
Main menu
You are here
Graphic Map Tab
Building a map has four general functions that need to be done:
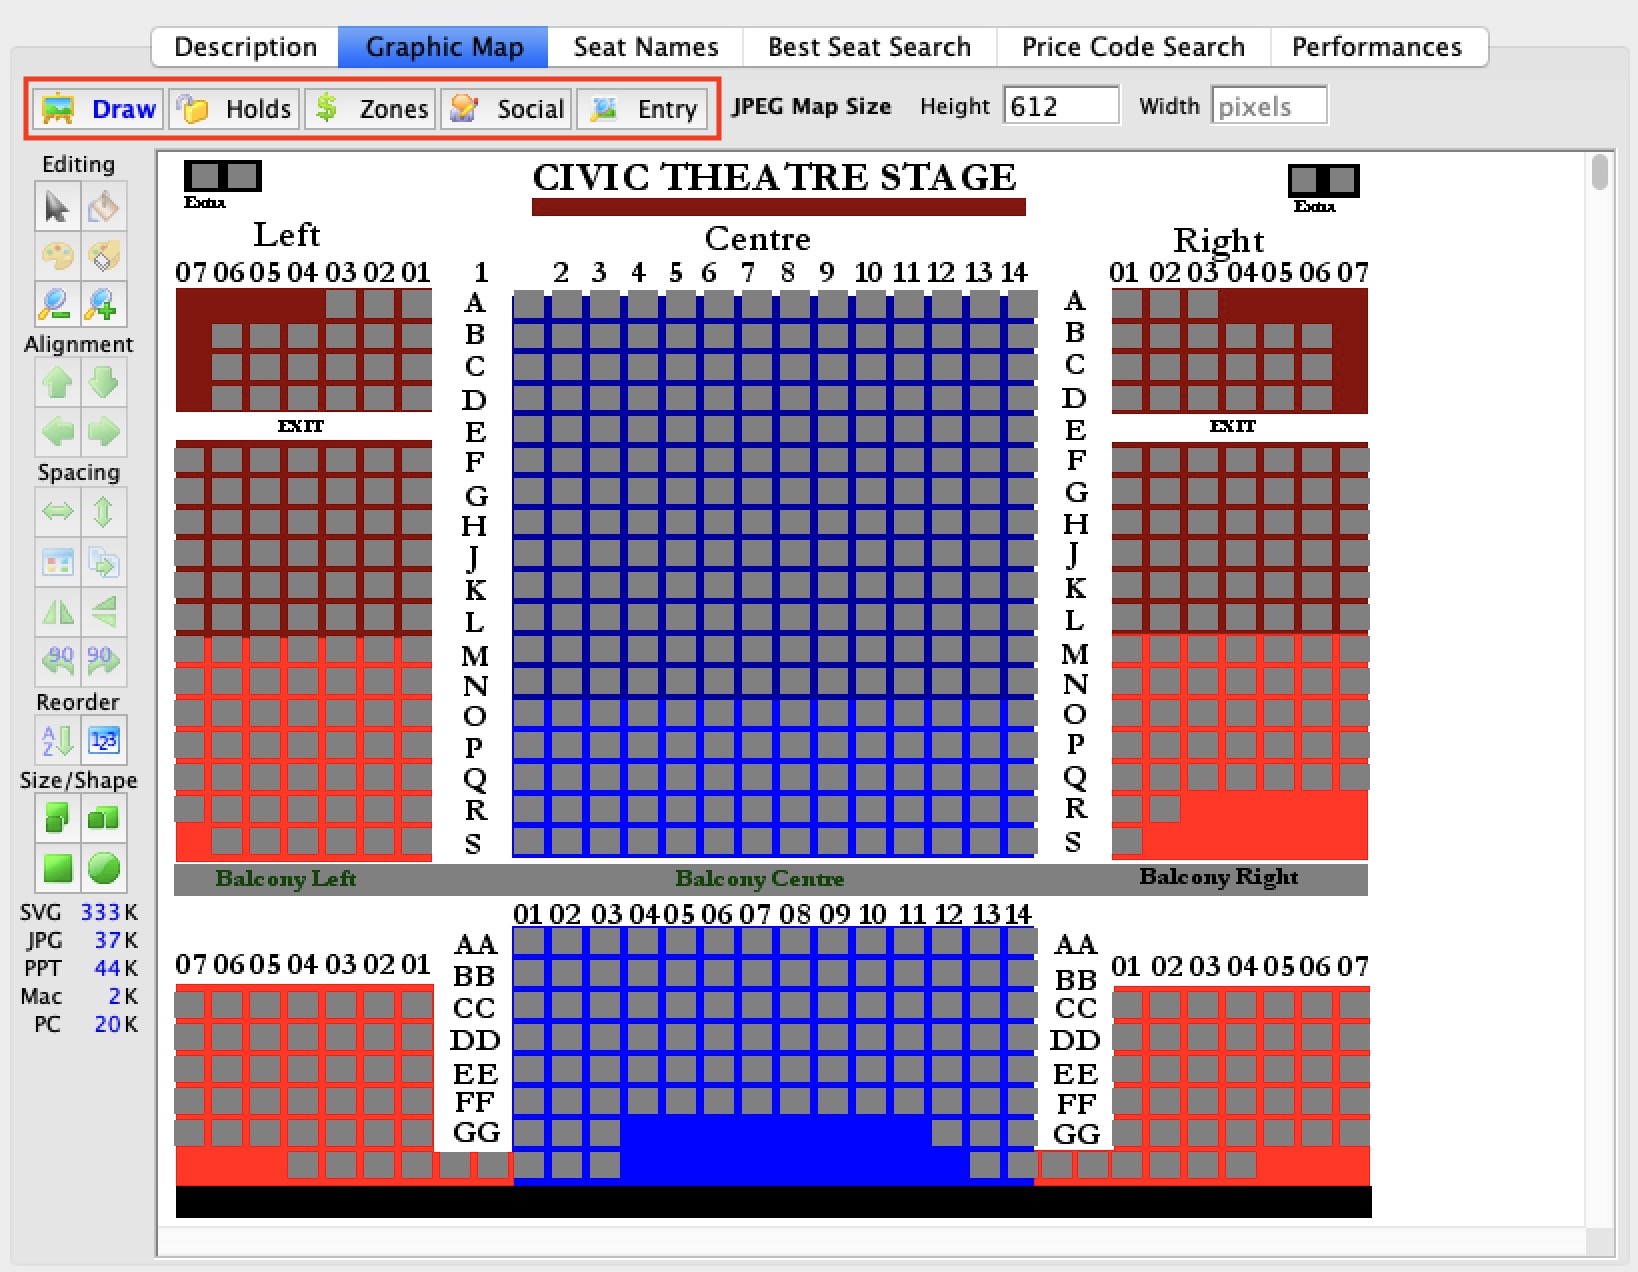
- Creating the SVG map graphic:
- by either drawing it in a tool like Powerpoint or importing a completed map from another venue using Theatre Manager
- Adding seating locations to the graphic map that users/patrons can click on to pick seats
- Deciding which seats are typically held (i.e. default holds) upon the creation of a performance in that pricing map. Typical examples are: lighting/sound board, orchestra takeaway, ADA/Wheelchair seating, artist holds, development, media, and trouble seats.
- Defining the base pricing zones within the venue
- Creating social distance seats:
- Automatic holds for ADA companion seats
- Seats in a dinner theatre for two-top's so that a patron will not have a stranger sitting opposite
- With the Covid 19 pandemic, Social Distance seats that are held automatically when some are bought to maintain an appropriate distance between patrons in all directions.
-
Defining how you want patrons to enter the venue by creating order of entry zones within the venue. This is somewhat like airline boarding process where the flight attendant asks 'people in zone X to board'. The zone can be printed on tickets.
The difference is that you would design the order of entry based on minimizing interaction with people (instead of how much the patron paid or how often they came).
Diataxis: