Main menu
You are here
Other Chart Functionality
There are a vriety of different things you can do to make the Gantt Chart work for you and your organization's projects. These are:
| Reading the Chart
|
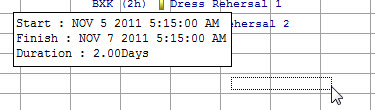
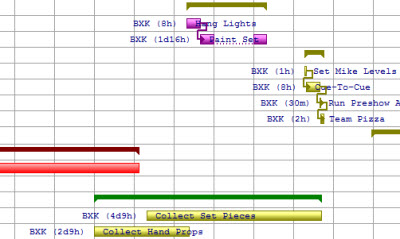
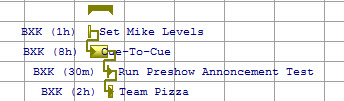
To the left of each Task is displayed the Owner and the length of the task in Days, Hours, Minute (#d#h) format.
On top of each task bar is the description of the task.
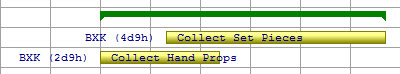
Groups are indicated a a bar with angled ends spanning all of the tasks in the group in the Treelist. |
| Changing Colours
|
Different tasks can be given different colours. These can be changed using the Gantt chart context menus. Click here for more information. |
| Suspending Tasks
|
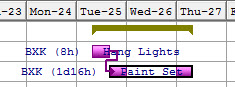
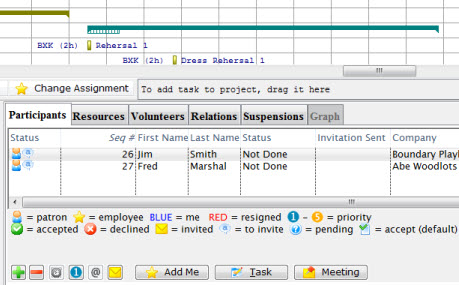
In one of the tasks you can see a gap in the middle of the task bar. This represents a suspension in the task... a time during which no work can be done on it. Click here to go to the Task Suspensions portion of the documentation. At this time, you can only have a single suspension in a given task. If you need more than this, break the task down into multiple tasks. |
| Task Relationships
|
You can also use arrows to connect tasks. These arrows indocate a replationship between the tasks.
Tasks can have the following relationships:
Click here for more information on how to set up relationships between tasks. |
| Detail Subwindow
|
If you click on a task, the detail area will open at the bottom of the window where you can edit information about the task. Click here for more information on the Detail Sub-window.
To Close the Detail Sub-window, click the Normal |
| Create New Task
|
You can create a task in this window by clicking your mouse button and dragging your cursor across a portion of the calendar where there is no task bar.
When you release the mouse button, a create new task window will open with the dates and times you specified by clicking and dragging. Click here for information on adding a task. |
 button in the Projects Toolbar / Ribbon bar.