
Main menu
You are here
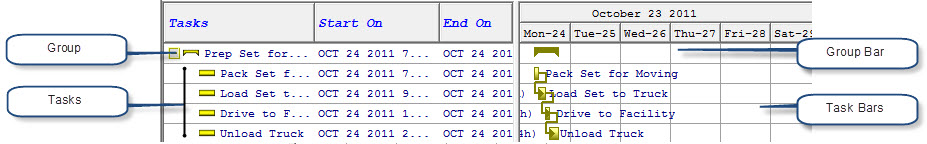
Project Gantt Chart
On the right side of the project window is the Gantt chart. It displays in a graphical form some of the details for each task in the project, including any temporal (time-related) relationship between tasks, how close it is to completion, etc.
Views
There are 5 different views of the Gantt chart: Hourly, 4 Hourly, Daily, Weekly, and Monthly.

Hours |
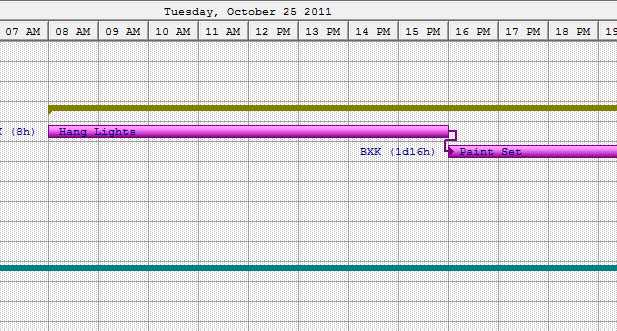
|

4 Hours |
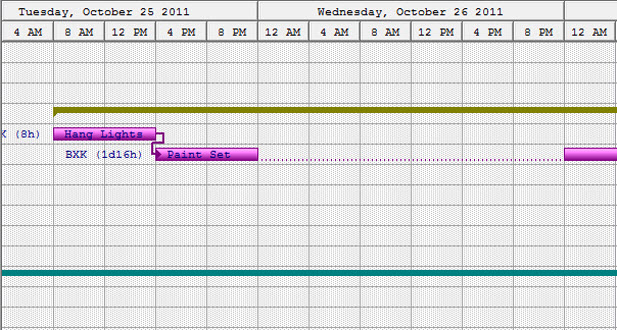
|
|
Days - This is the Default |
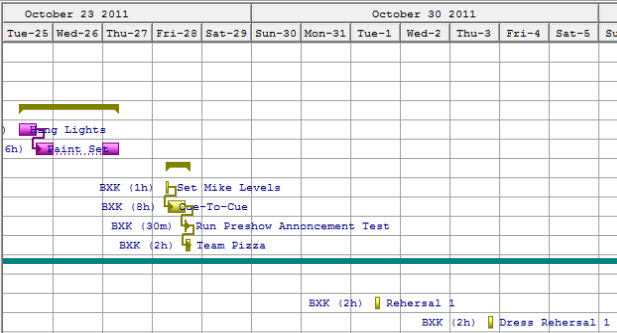
|

Weeks |
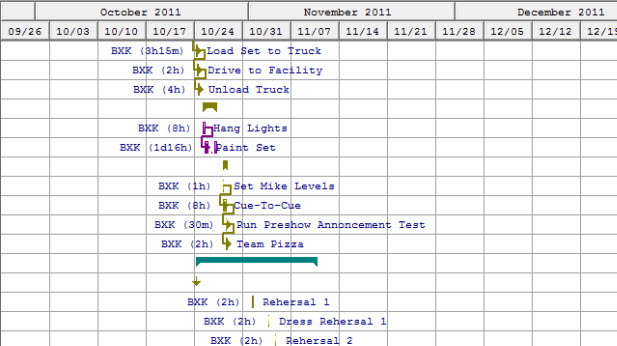
|

Months |
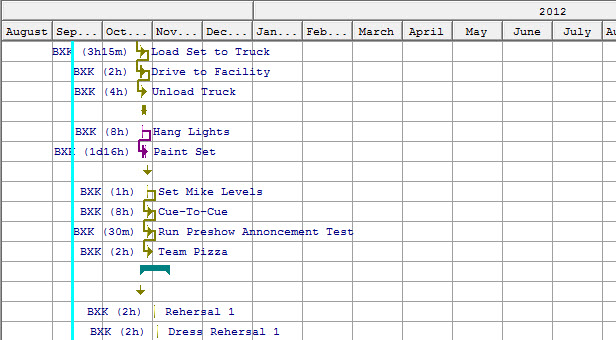
|