You are here
Potential Revenue From Unsold Tickets
The Potential Revenue From Unsold Tickets report can be found under the Ticket Printing, Invoicing and Inventory Analysis category. This report has additional criteria options. Click for more information about:

Purpose of the Report
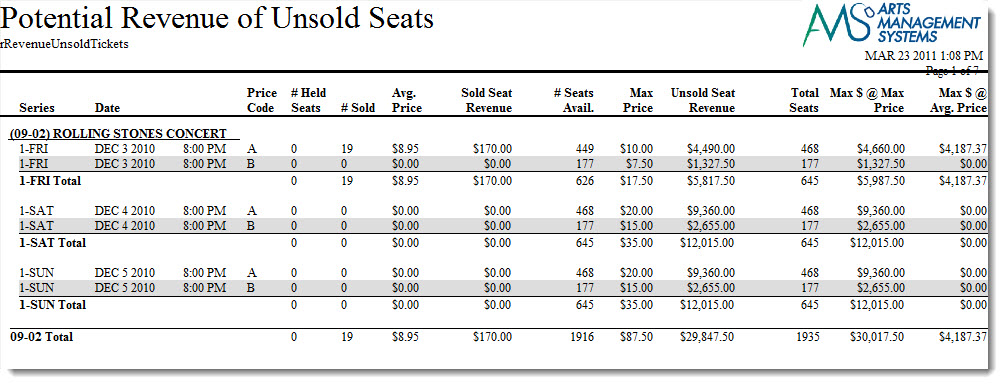
This report generates a listing of the potential revenue based on the price code structure and the number of seats available.
 |
In all cases, you will need to factor in your expected sales percentage. For example, if you typically only sell 80% of a house, then multiply any of the revenue figures in the report by 80% to determine expected revenue or attendance.
If you know this event will be sold out, then you can use the figures as printed. |
The meaning of the columns are:
| Price Code |
This is the price code for the section of the venue representing the base price. Most venues have one price code per section. Some have two that may represent base pice regular priced tickets and base price for subscriptions.
If there are multiple price codes for a seat, then the one with the highest base price is used (since it represents the highest possible sale price) and any price code with a lower base price is ignored (since the projected price wold be lower). This report helps predict best if your pricing is based on fewer price codes and more promotions to discount tickets in a section. |
| # Held Seats | This count indicates the number of seats that are marked as 'held' in that pricing zone. |
| # Sold | This count indicates the number of seats that are already sold in this pricing zone. Sold seats help determine the average price that people are willing to pay to sit in that section. And since they are sold, already dictate the maximum revenue for those specific seats. |
| Average Price |
The average price is the total sold seat revenue (see next column) for the event in that section divided by the number of seats sold. The average price is used as one of the predictors for maximum revenue.
Traditionally, subscriptions are sold first. That lowers the average revenue. Then single tickets come on sale which starts to nudge the average revenue upwards (over the sales cycle). |
| Sold Seat Revenue | Sold Seat Revenue is the total revenue for the seats sold so far for all promotions/discounts. |
| # Seats Available | The seats available are the number of seats in that price code/section that can still be sold. These seats are the foundation onto calculating the maximum possible revenue. |
| Max Price | The Maximum price is the highest possible price that can be paid for seats in that price zone. |
| Unsold Seat Revenue | This is the number of unsold seats times the highest base price that the seat can be sold for. It represents the maximum that you revenue that you can get if you sold all remaining seats at this maximum price. |
| Total Seats | Total seats is number of seats that cold used this price code (including current solds and helds). For a performance, the total should be the same as the number of seats in the venue. |
| Max $ at Max Price |
Maximum $ at max price is calculated as:
Current sold seat revenue + all remaining seats sold at maximum price. you will likely never reach this revenue total unless:
|
| Max $ at Average Price |
Current sold seat revenue + all remaining seats sold at the average price.
As the sales cycle progresses more tickets are sold, this becomes the most likely predictor of future revenue. |
Departments Who Benefit From This Report
| Box Office | Use this report to see how much money can be earned for a performance and is still to be earned. |
| Accounting | Use this report to see how much money can be earned for a performance and is still to be earned. |
| General Manager | Use this report to see how much money can be earned for a performance and is still to be earned. |
Criteria Hints
It is highly recommended that this report be run with a specific event or events as the criteria.
| Parameter Field | Condition | Value |
| Event # | is one of | (Event) |
Use the SHIFT key to select a series of events, or the OPTION key (Mac) or CTRL key (Windows) to select multiple individual events.
