Gantt Chart and Treelist Project Viewing
A Gantt chart is a graphical representation of the duration of tasks against the progression of time. A Gantt chart is a useful tool for planning and scheduling projects.
A Gantt chart is helpful when monitoring a project's progress. A Gantt chart is a type of bar chart that illustrates a project schedule. Gantt charts illustrate the start and finish dates of the terminal elements and summary elements of a project.
Terminal elements and summary elements comprise the work breakdown structure of the project. They also show the dependency relationships between activities. When you are planning, scheduling and monitoring a project, you can use a Gantt chart to plan how long a project should take. It lays out the order in which the tasks need to be carried out. When the project has started, a Gantt chart lets you see immediately what should have been achieved at any point in time and then lets you see how remedial action may bring the project back on course.Also available in the charting window is the Treelist. Simply defined the treelist represents the structure of the project in a heirarchical format. It works very much like the table of contents in a book, allowing you to group together tasks. How you organize groups and tasks in the Treelist, organizes them in the Gantt Chart.
To Open the Gantt Chart, you perform the following steps:- Click the Projects
 button in the main Theatre Manager toolbar / ribbon bar.
The Project List Window opens.
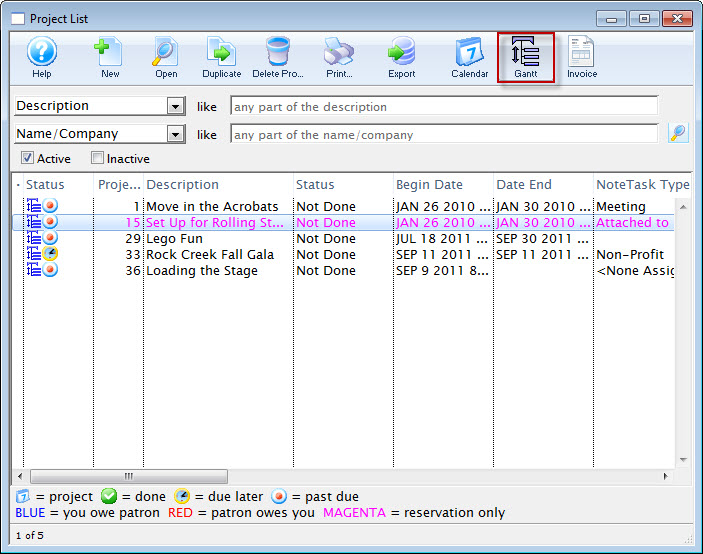
- Highlight the Project you want to view and click the Gantt
 button.
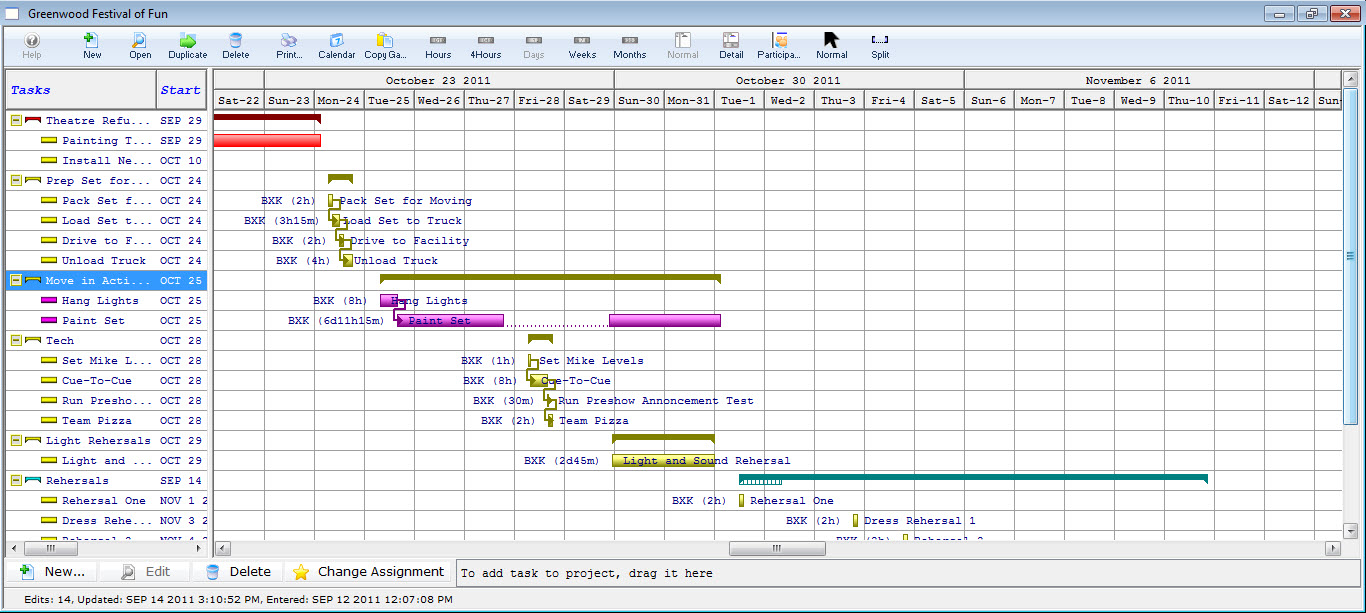
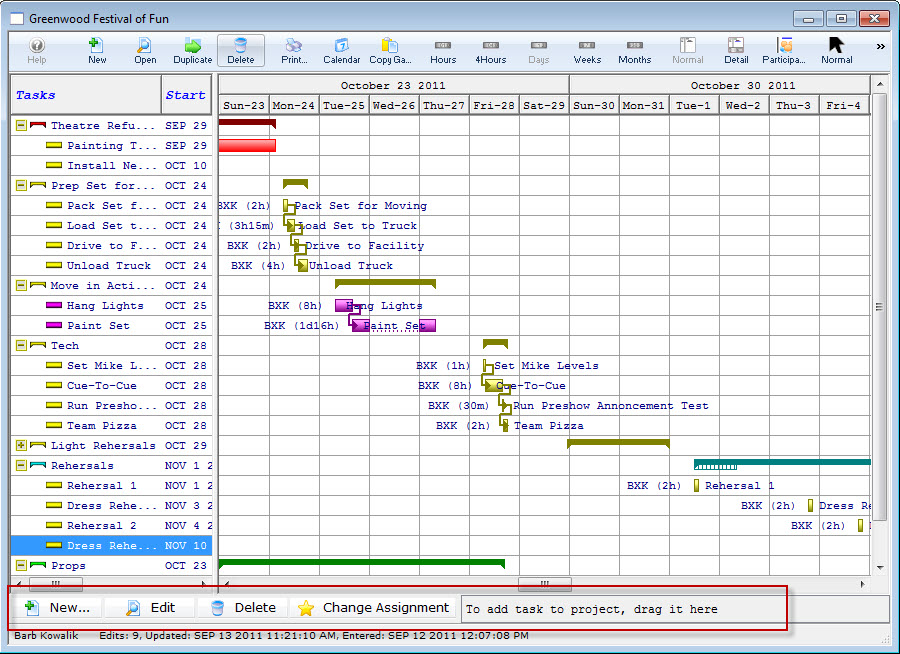
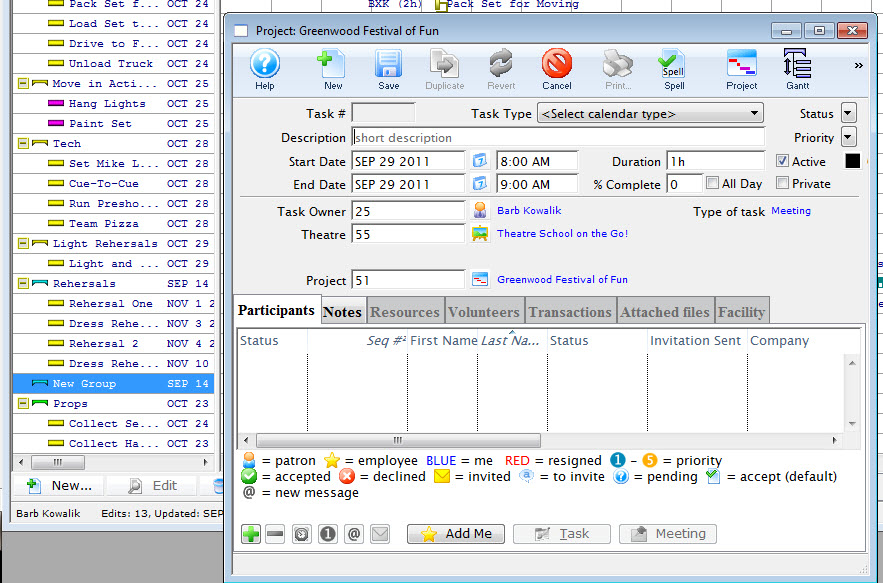
The Projects Window opens.
|
This window saves information a little differently from other portions of Theatre Manager. As soon as a change is made, it is saved. This allows immediate feedback and changes in this window. When editing this way, you MUST press the Return key to save the data. |

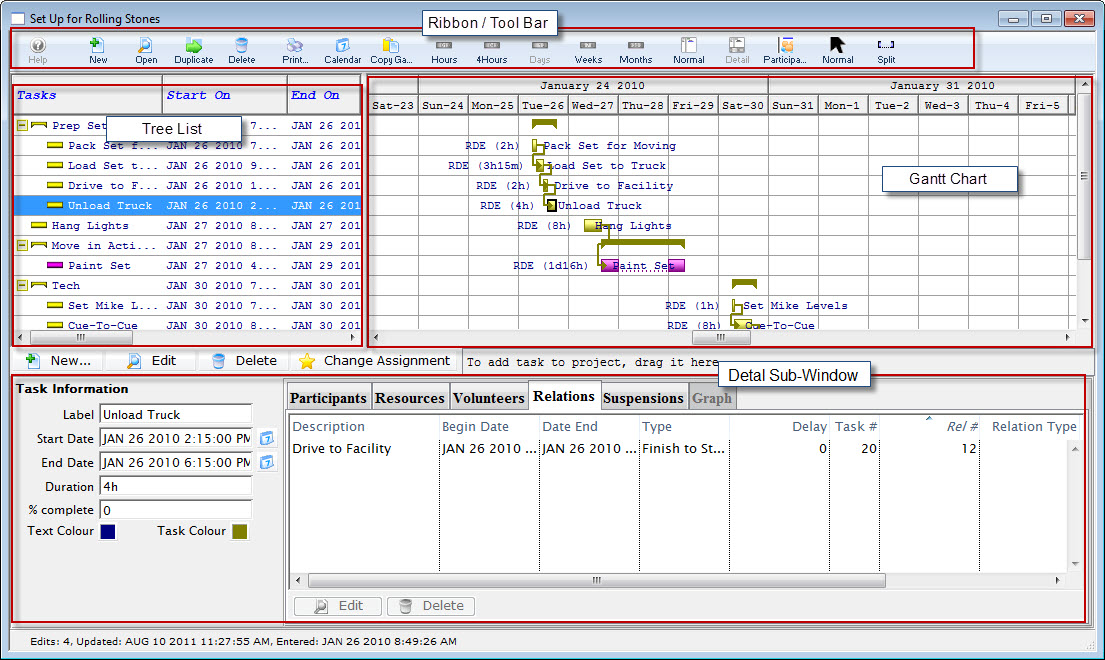
Parts of the Window
| Toolbar / Ribbon Bar | The Projects toolbar / ribbon bar has a number of different selections that do not appear in other windows. Click here For a more detailed description. |
| Tree List | On the left is the treelist. It displays the parts of the project along with their groupings. You can have a hierarchy of tasks, allowing for lists of tasks to be grouped together under a common title. You can change items in the treelist by double-clicking on the text you want to change. Click here for more information on the Tree List. |
| Gnatt Chart | A Gantt chart is a type of bar chart that illustrates a project schedule. Gantt charts illustrate the start and finish dates of the terminal elements and summary elements of a project. Terminal elements and summary elements comprise the work breakdown structure of the project. It displays in a graphical form some of the details for each task in the project, including any temporal (time-related) relationship between tasks, how close it is to completion, etc. Click here for more information on using Facility Management's Gantt Charts. |
| Task Detail Sub-Window | By single clicking on a task in the Gantt chart, you can see a detail subwindow showing the details of the selected task. Click here for more information on how to use the Detail Editing sub-window. |
Project Toolbar / Ribbon Bar

Functions
 |
New | Create a New Project. Click here for information on New Projects. | ||
 |
Open | Opens the current project for editing. Click here for information on editing projects. | ||
 |
Duplicate | Duplicates the entire project. Click here for information on the Duplication Wizard. | ||
 |
Delete | Deletes the current project. | ||
 |
Opens the Gantt Print dialog. Click here for more information. | |||
 |
Calendar | View the project in a calendar. | Copy Gantt | Copies an image of the Gantt chart to your computer's clipboard, then you can paste the calendar into other applications. |
 |
Hours | Shows the time scale of the Gantt Chart in hours. Click here for more information on Gantt Time Periods. | ||
 |
4 Hours | Shows the timescale of the Gantt Chart in 4 hour increments. Click here for more information on Gantt Time Periods. | ||
 |
Days | Shows the time scale in days (default). Click here for more information on Gantt Time Periods. | ||
 |
Weeks | Shows the timescale in weeks. Click here for more information on Gantt Time Periods. | ||
 |
Months | Shows the time scale in Months. Click here for more information on Gantt Time Periods. | ||
 |
Normal | Returns to the Normal view from other views. Click here for more information on the Normal view. | ||
 |
Detail | Opens the Task Detail portion of the window. Cliick here for a detailed exploration of the Detail sub-window. | ||

| Participants | View the chart broken down by Participant.Click here for more information on the participant view. | ||
 |
Normal | Change the cursor back to the Normal mode in order to cancel creation of a suspension in a task. Click here more information. | ||
 |
Split | Changes the cursor to the Split mode to create a suspension in a task. Click here for more information. |
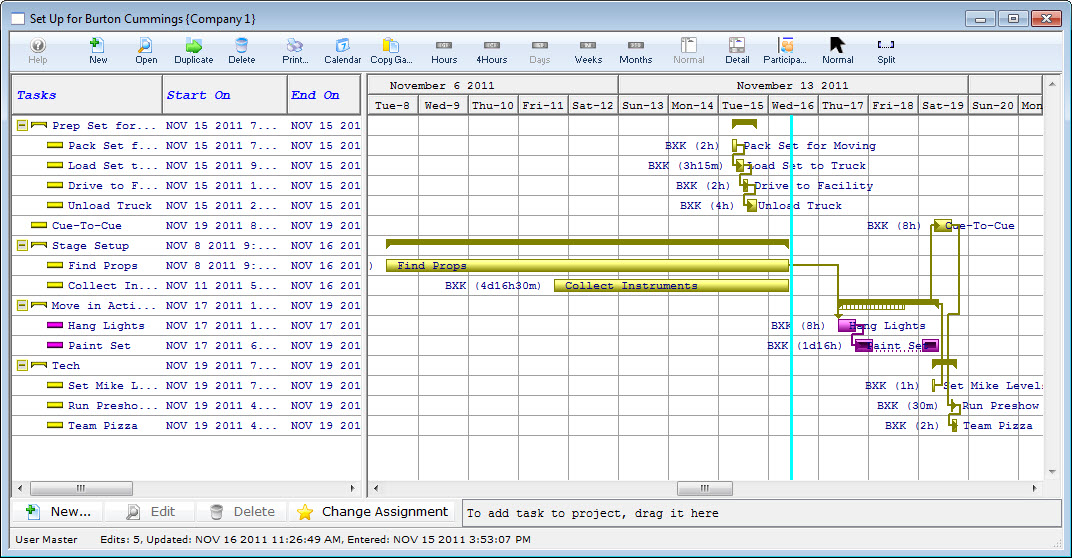
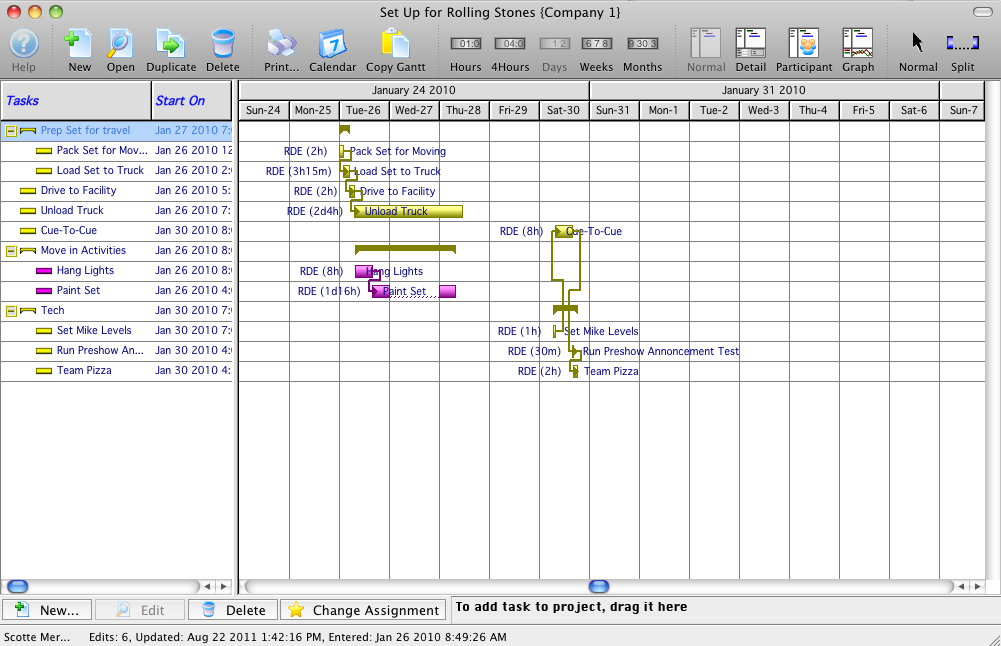
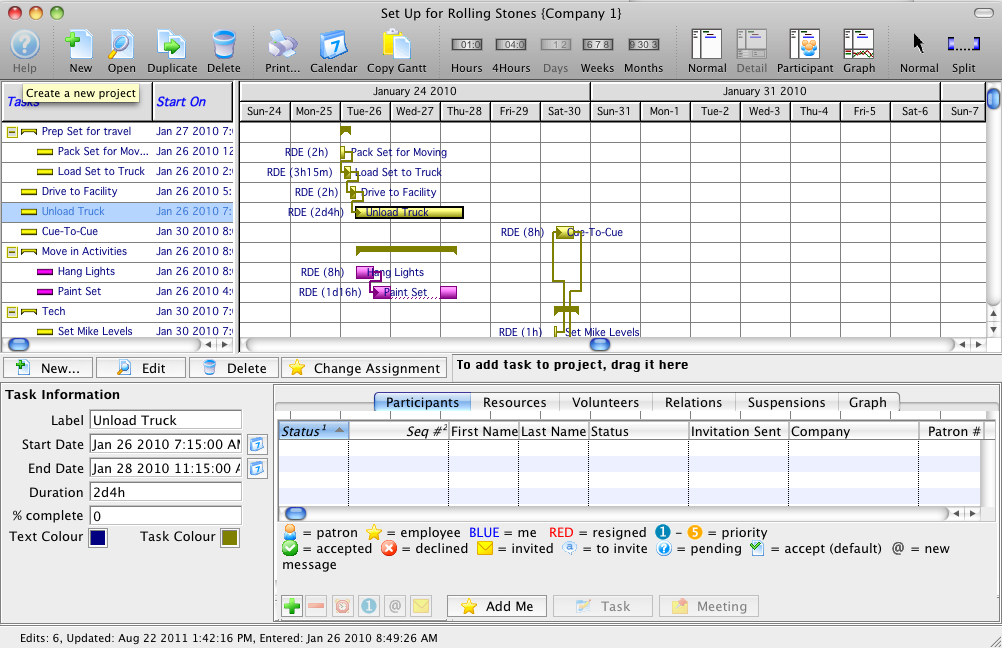
Normal View
In the Gantt Normal view, each task is displayed under its group. Groups are used to associate tasks with each other. There is no detail subwindow at the bottom.
Detail View
In the Gantt Detail view, there is a detail subwindow at the bottom where you can see detail information for each task or group and edit any appropriate portions. The Detail view is applicable for both the Normal and Participant views of the data.
See the Detail Editing Subwindow page for more information.
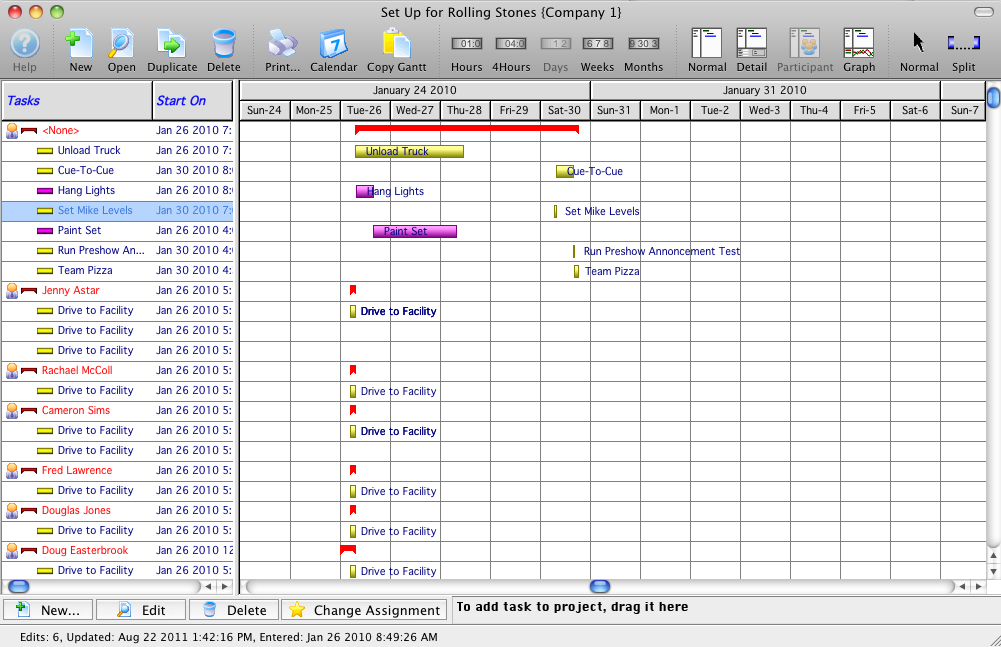
Participant View
In the Gantt Participant view, each participant is displayed on the treelist side of the window with each of their tasks underneath. This may cause some tasks to display multiple times... once under each person who is a participant in this task. At the top may be a participant called "<None>", indicating tasks without any participants.
Printing the Chart
- To start, click the Print button in the Project Detail Toolbar / Ribbon Bar.
Your operating system print dialog opens.
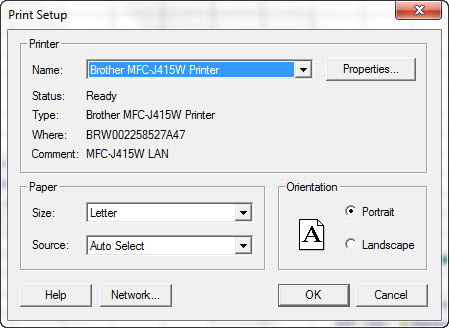
- Click the OK button.
The Gantt Representation of Project Criteria window opens.
Click here for more information on the options available.
- Review and select the appropriate options. When complete, click the Next
 button.
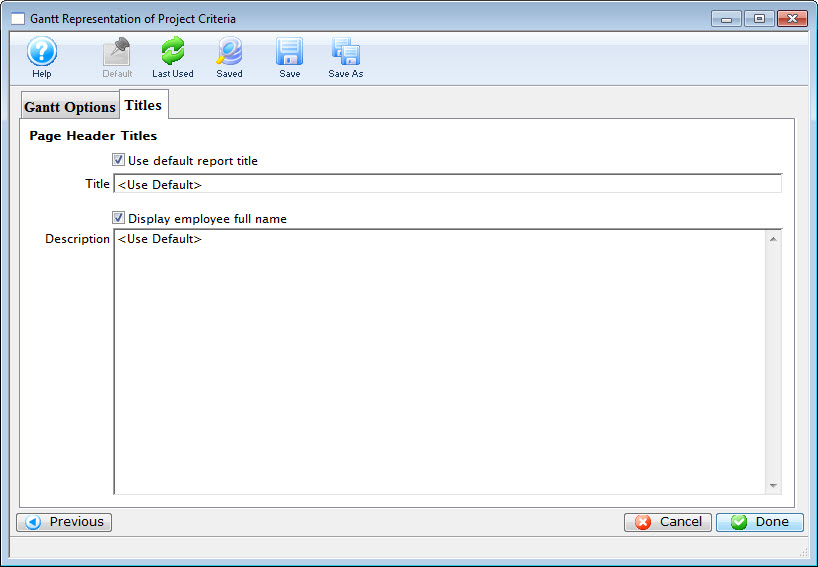
The Title tab opens. Click here for an explanation of this tab.
- Click the Done
 button.
This generates the selected report and opens the Finished Report window.
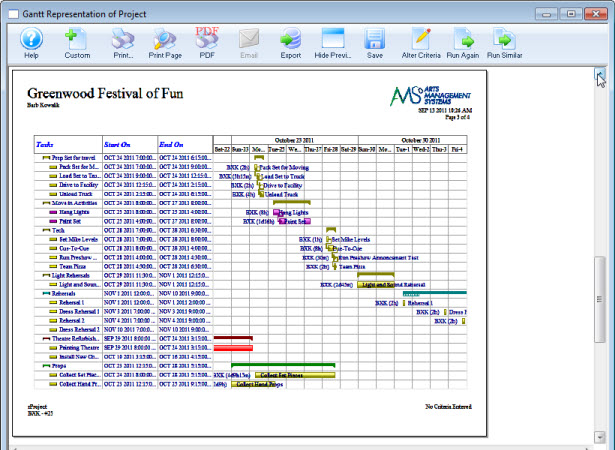
Click here for more information on the Finished Reports window.
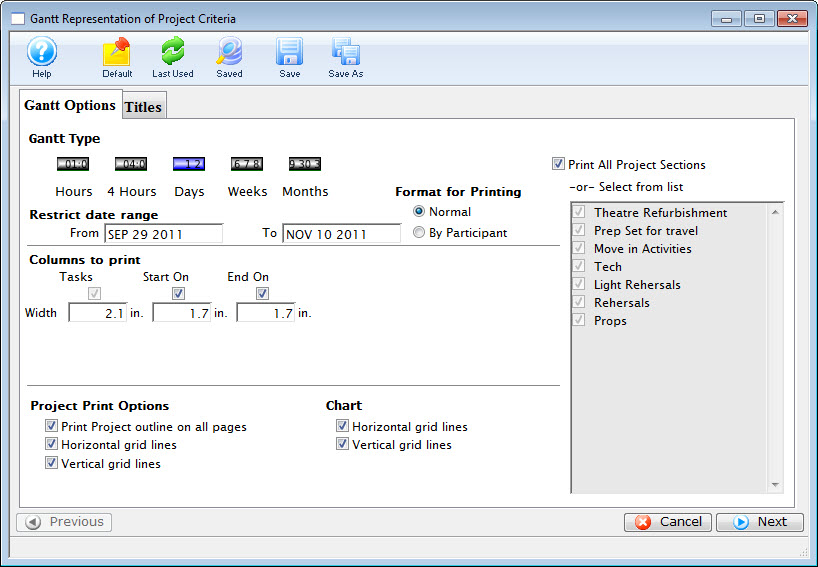
Gantt Printing Options
Parts of the Gantt Options Tab
| Gantt Type | You have the option of selecting:
|
| Restrict Date Range | Enter a Date in the From and the To boxes to change the date range. The default is the start and the end dates of the project. |
| Print All Project Selections | The default is to print all of the Groups you have
defined in your project. To print specific groups only,
Disable the checkbox 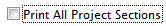 .
You can then select the groups you want from the list. .
You can then select the groups you want from the list.
|
| Columns to Print | This option diplays the columns you selected in the tree list. You can enable or disable specific columns and you can change the width of the columns. |
| Project Print Options | Disabling and enabling the checkboxes allows you to print:
|
| Chart | Disabling and enabling the checkboxes allows you to printt:
|
 |
Cancels the printing of the report |
 |
Next moves to the Titles tab. |
 - Prints the whole project in 1 hour increments.
 - Prints the whole project in 4 hour increments.
 - Prints the whole project in 1 day increments (Default).
 - Prints the whole project in 1 week increments.
 - Prints the whole project in 1 month increments.
Graph View
Graph view is not currently available
Project Treelist
On the left side of the project window is the treelist. Treelist is very useful in organizing your tasks. The treelist is a table of the tasks in the order they are to be completed. It also allows you to group like tasks under headings. How you organize groups and tasks in the Treelist, organizes them in the Gantt Chart.
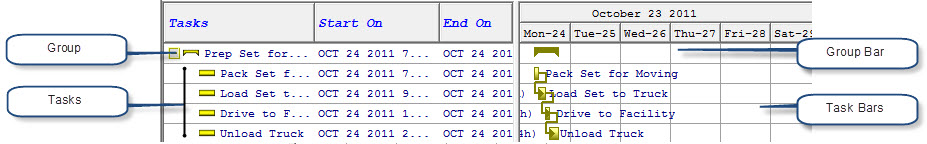
You can see two types of lines in the treelist, Groups and Tasks.
- Groups are only used to assemble tasks together. Groups are higher levels of the outline that are used only to group tasks together. Each line indicates the starting and ending times for each task or group.
- Tasks are the individual activities that make up your project. Click here for more information on Tasks and how to set them up.
Right-clicking anywhere in the Treelist will bring up the context menu.
Organizing Tasks in the Treelist
You can drag either groups or tasks inside other groups in order to further indent them. You can also drag a group or task to a different level within the outline.
 |
In this case, we are dragging the Dress rehearsal 1 task inside the Rehearsals group. Notice the arrow on the left side of the bar. It indicates that this dragged item will be dragged inside the group under which it has been dropped. If you attempt to drag inside a task instead of a group, the drag is simply ignored because it is inappropriate. |
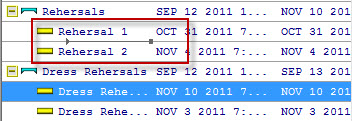 |
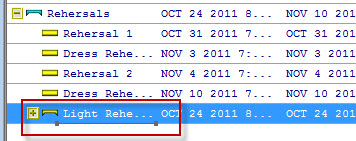
In this example, we are going to move the Dress
Rehersal Tasks from the Dress Rehersal Group to the Rehersals Group by
clicking and dragging. In the image the task to be moved has been highlighted and "dragged" to the line of the appropriate spot. Note the line looks like |
 |
Notice the lack of an arrow on the left side of the bar. This indicates that this dragged item will be dragged just below the task (or group) under which it has been dropped. The order things are dragged into is maintained the next time you reopen the project. |
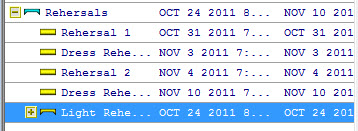 |
In this picture, the Group Light Rehersals is part of the rehersals group |
 |
We Click and Drag until we see |
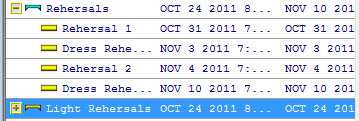 |
When we let go of the button, the Group is no longer part of the Rehersals Group, but is at the same level. |
Editing in the Treelist
Editing the name of a task or a group of tasks and their starting or ending dates is simple in the treelist.
In the treelist, you can edit the name of a task and the Start On and End On dates, by clicking on what you want to change, make the change and press Return.
|
You must press Return rather than clicking out of the field or pressing the Tab key or the changes are not saved. |
Quick Add Tasks in the Treelist
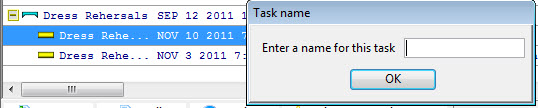
When a line is selected in the treelist, you can go into Quick Add mode by pressing Return. This will display a dialog box allowing you to just enter a task description. It will create a new task at that same level in the outline and save just enough task information to serve as a placeholder in the project. Later you can go back and enter the rest of the task information. This will help you quickly put together the list of the tasks required for your project.
Editing Treelist Columns
You can add and remove columns in the treelist, change the order, and alter the text displayed at the top of each column by right-clicking on the treelist header area.
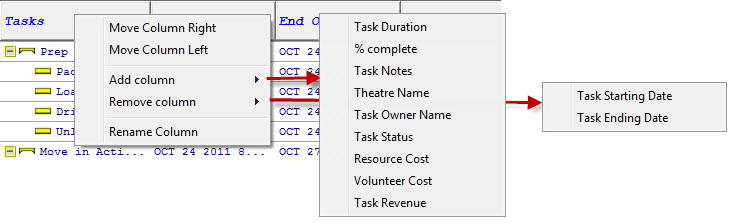
The first column cannot be moved and cannot be removed. Other selections are:
- Move Column Right - moves the selected column to the right.
- Move Column Left - moves the selected column to the left.
- Add Column - the selection brings up a flyout of available columns that are not currently displayed. Selection one will add it to the Treelist display.
- Remove Column - displays a listing of the columns currently being displayed. Selecting one will remove it from the Treelist display.
- Rename Column - allows you to change the text in the header area of the selected column.
Project Gantt Chart
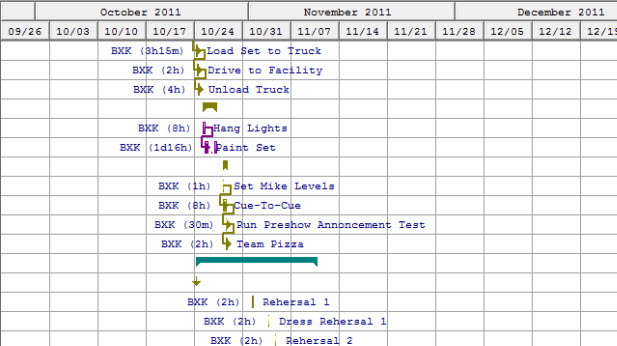
On the right side of the project window is the Gantt chart. It displays in a graphical form some of the details for each task in the project, including any temporal (time-related) relationship between tasks, how close it is to completion, etc.
Views
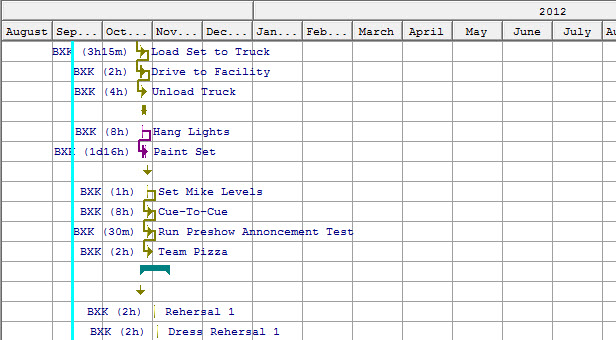
There are 5 different views of the Gantt chart: Hourly, 4 Hourly, Daily, Weekly, and Monthly.
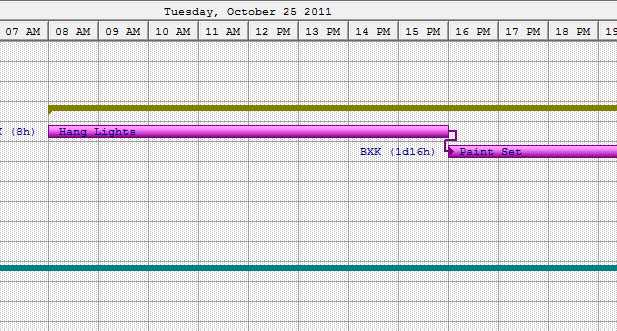
|
Hours |
|
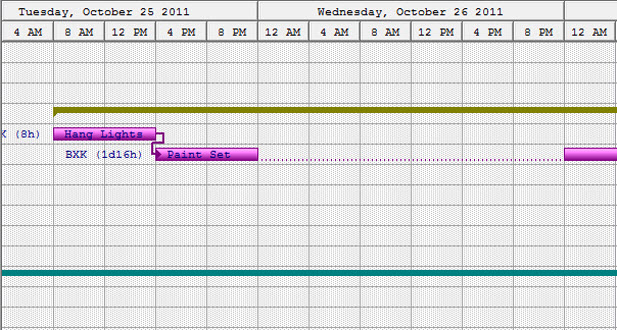
|
4 Hours |
|
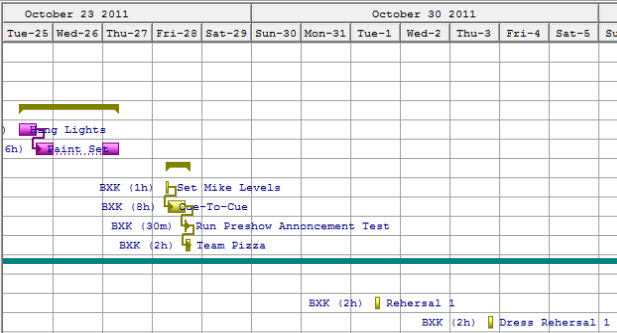
|
Days - This is the Default |
|
|
Weeks |
|
|
Months |
|
Chart Cursor
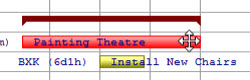 |
When the cursor is above most parts of the task bar it changes to a 4-way arrow. When in this mode you can drag tasks to the right or left to change the starting and ending times of the task. |
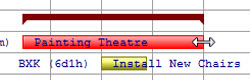 |
When the cursor is on the right end of the task bar it changes to a 2-way arrow. When in this mode you can also grab the end-point of a task and stretch it to the left or right to shorten or expand the length of the task. |
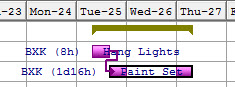
 |
When the cursor is just past the left end of the task bar it changes to a pencil. When in this mode, you can drag across the task bar to fill in a dark area in the middle of the bar to indicate what portion of the task has been completed. When you do this, you will see a series of little squares in the group marker for that group indicating the percentage complete for all the tasks within the group. |
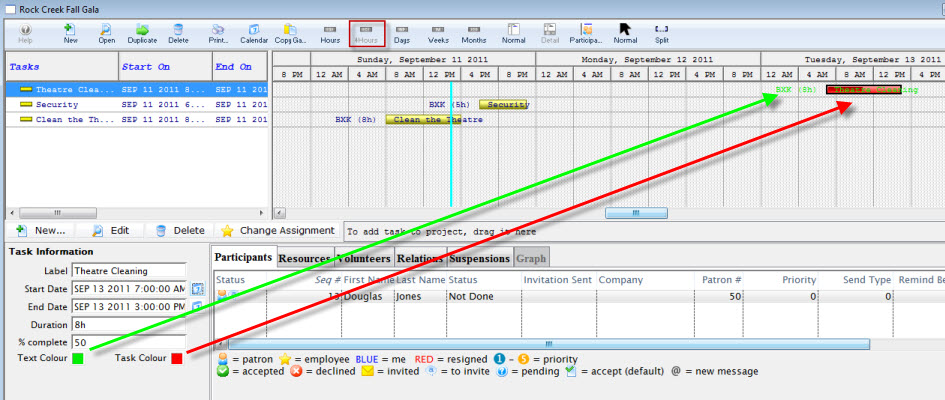
Other Chart Functionality
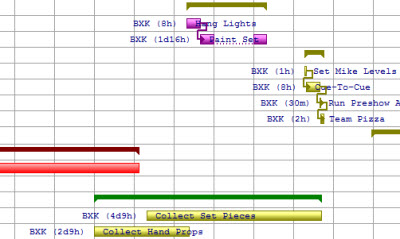
| Reading the Chart
|
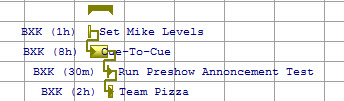
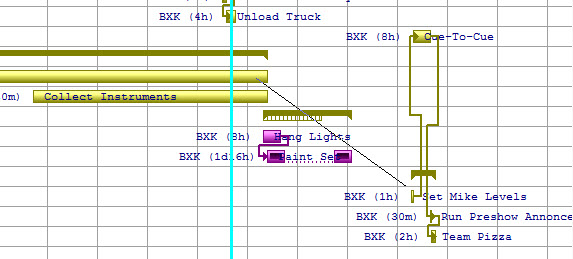
To the left of each Task is displayed the Owner and the length of the task in Days, Hours, Minute (#d#h) format.
On top of each task bar is the description of the task.
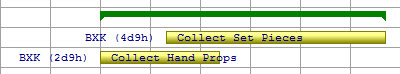
Groups are indicated a a bar with angled ends spanning all of the tasks in the group in the Treelist. |
| Changing Colours
|
Different tasks can be given different colours. These can be changed using the Gantt chart context menus. Click here for more information. |
| Suspending Tasks
|
In one of the tasks you can see a gap in the middle of the task bar. This represents a suspension in the task... a time during which no work can be done on it. Click here to go to the Task Suspensions portion of the documentation. At this time, you can only have a single suspension in a given task. If you need more than this, break the task down into multiple tasks. |
| Task Relationships
|
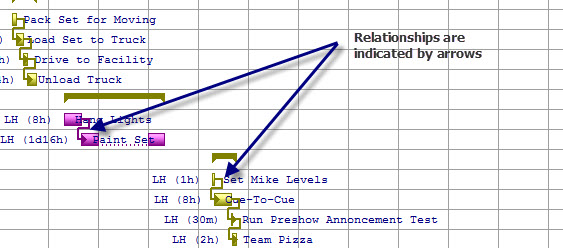
You can also use arrows to connect tasks. These arrows indocate a replationship between the tasks.
Tasks can have the following relationships:
Click here for more information on how to set up relationships between tasks. |
| Detail Subwindow
|
If you click on a task, the detail area will open at the bottom of the window where you can edit information about the task. Click here for more information on the Detail Sub-window.
To Close the Detail Sub-window, click the Normal |
| Create New Task
|
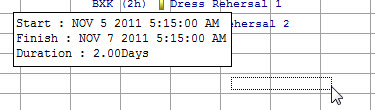
You can create a task in this window by clicking your mouse button and dragging your cursor across a portion of the calendar where there is no task bar.
When you release the mouse button, a create new task window will open with the dates and times you specified by clicking and dragging. Click here for information on adding a task. |
Relationships Between Tasks
To add a relationship, you would perform the following steps:
- Click on one task and drag from one task to another.
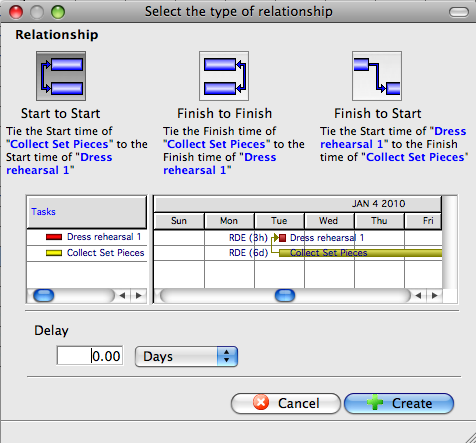
You will see a "string" that connects the two tasks. The Select Relationships Between Two Tasks window opens.
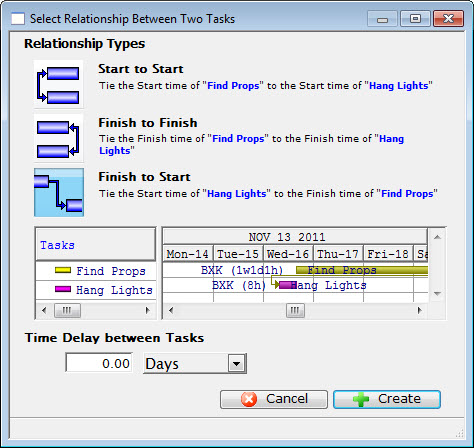
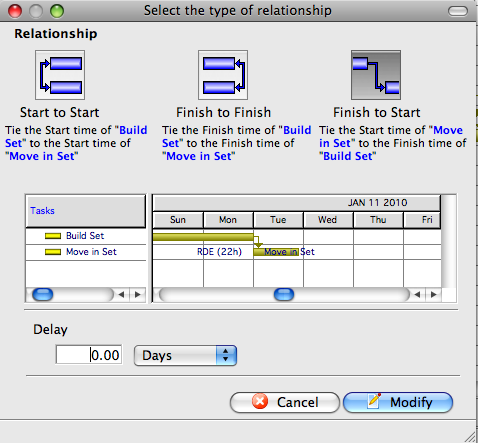
- Make your selection by clicking on the appropriate button:
 - Start to Start - Ties the starting time of the two tasks together.
 - Finish to Finish - Ties the end time of the two tasks together.
 - Start to Finish - Ties the end time of one task to the starting time of the second.
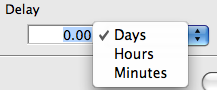
 - If required, you can select a time delay for the relationship. Enter a number and/or select the appropriate time period for the drop down list.

- When your relationship is set up click the Create
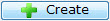 button.
Detail Editing Subwindow
When you click on one of the tasks on the Gantt chart, or click the Detail button on the toolbar, the detail editing subwindow displays at the bottom of the project window.
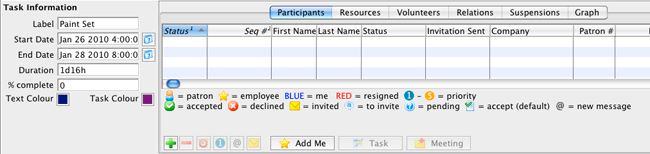
The lower part of the window is divided into two sections. The left side is Task Information.
- Click here for more on Task Information.
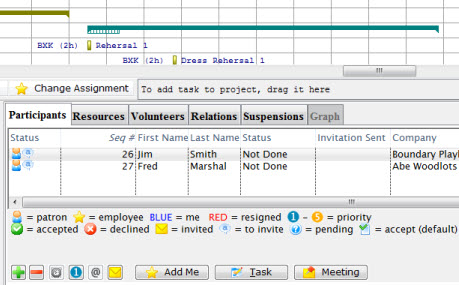
The right is made up of six tabs. They are:
- Task Participants - Click here for more information on Task Participants tab.
- Resources - Click here for more information on the Resources tab.
- Volunteers - Click here for more information on the Volunteers tab.
- Relations - Click here for more information on the Relations tab.
- Suspensions - Click here for more information on the Suspensions tab.
- Graph - Click here for more information on the Graph tab. .
Task Information
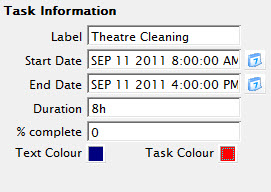
With any items in this window, as soon as you leave a field or make a selection the information is saved and the screen is updated and saved for the task.
In this window you can change:
| Label | The Label given to the Task. |
| Start Date | The starting date/time for the task. Enter the date and time or click on the Calendar  button to make any change. button to make any change. |
| End Date | The starting date/time for the task. Enter the date and time or click on the Calendar button to make any change. |
| Duration |
The duration of the task in the format 4w 3d 2h 1m. Adjusts as the starting or ending dates and times are changed. |
| % Complete | Indicates the amount of the task that is complete (as entered here or in the task window). |
| Text Colour | 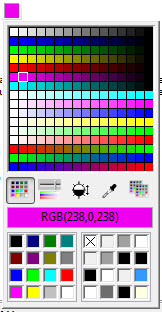 The colour of the text that displays on the task bar in this window. Click the colour box to change the colour. The colour of the text that displays on the task bar in this window. Click the colour box to change the colour. |
| Task Colour | >The Colour of the task bar displayed in this window. Click the colour box to change the colour. |
Task Participants
This is the same subwindow used in the Task Detail window. You can attach people to the task and set other information appropriate for the participants in the task.
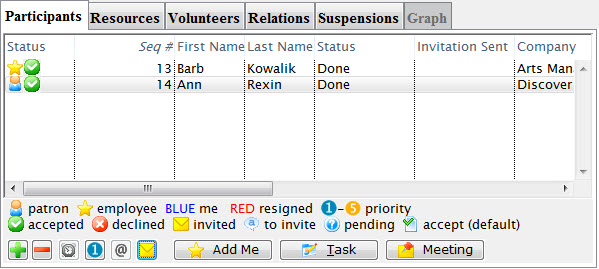
With any items in this window, as soon as you leave a field or make a selection the information is saved and the screen is updated.
Click here for complete information on this window and its funtions.
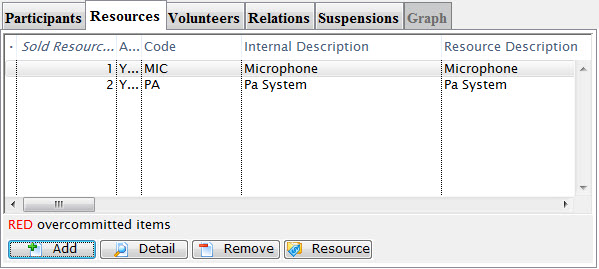
Resources
This is the same subwindow used in the Task Detail window. You can attach resources to the task and set other information appropriate for the resources in the task.
With any items in this window, as soon as you leave a field or make a selection the information is saved and the screen is updated.
Click here for complete information on this window and its funtions.
Volunteers
The Volunteers tab displays volunteers for the currently selected task.
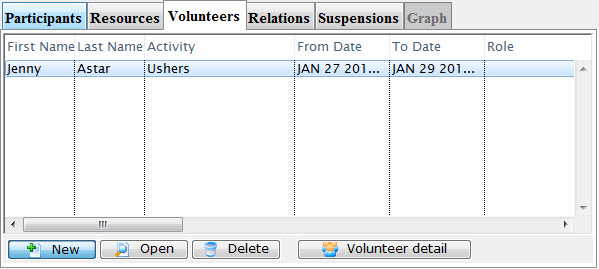
Parts of the Volunteers Tab
 |
Click the New button to add a volunteer to the task. Click here for information on adding a volunteer. |
 |
Opens the Activity history window for the selected volunteer. Click here for more information on Activity History. |
 |
Clicking the Delete button, deletes the selected volunteer history record. |
 |
Opens the Volunteer History record for the selected volunteer. Click here for more information on the Volunteer History Window. |
In this tab, you can add new or delete volunteers, and view the volunteer record.
With any items in this window, as soon as you leave a field or make a selection the information is saved and the screen is updated.Add a Volunteer
You can add participants to a task in this window. To do so, you perform the following steps:
- In the Volunteers tab, click the New button.
The Volunteer List window opens.
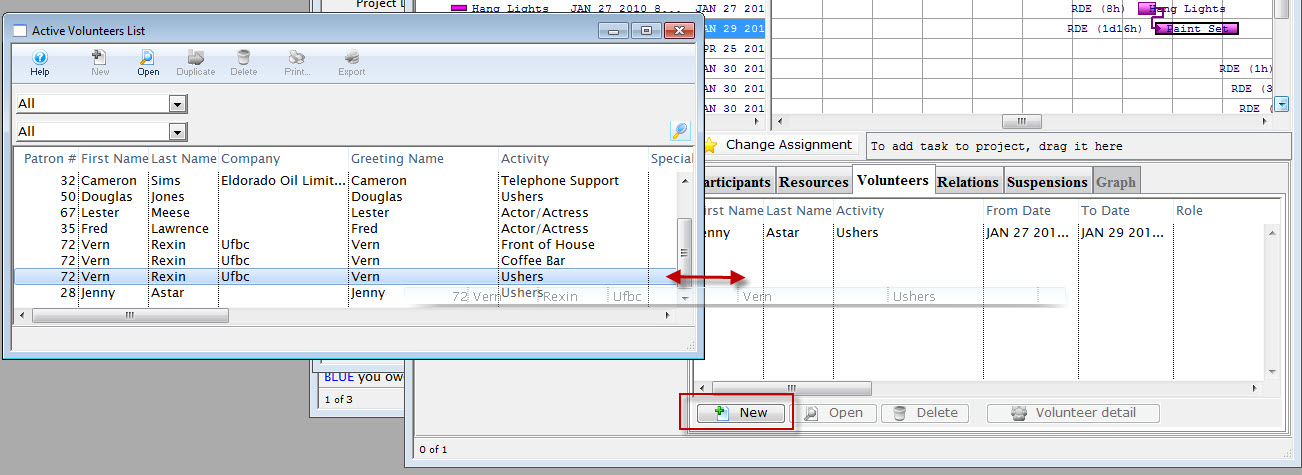
- Choose the volunteer to add to the project task and "drag" and "drop".
With any items in this window, as soon as you leave a field or make a selection the information is saved and the screen is updated.
Relations Tab
This window shows you the relationships between different tasks. In this tab, you can only edit or delete relationships, you cannot add them.
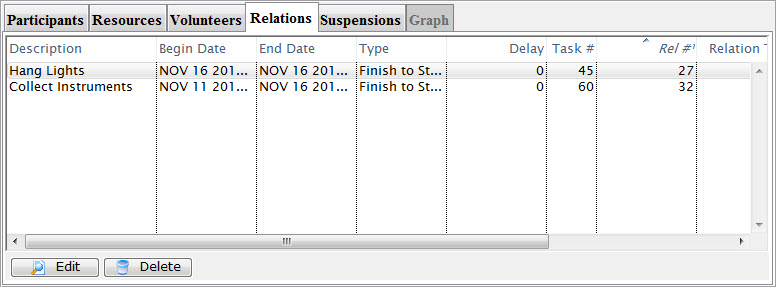
This window displays the types of relationships available between tasks. You can select which type and indicate any delays.
If you select Start to Start, the starting time of one task is tied to the starting time of the other. In other words the starting time of the second task cannot start any earlier than the starting time of the first task.
You can also implement a delay such that a certain number of days, hours, or minutes must elapse before the second task begins.
If you select Finish to Finish, the ending time of one task is tied to the ending time of the other. In other words the ending time of the second task cannot start any earlier than the ending time of the first task.
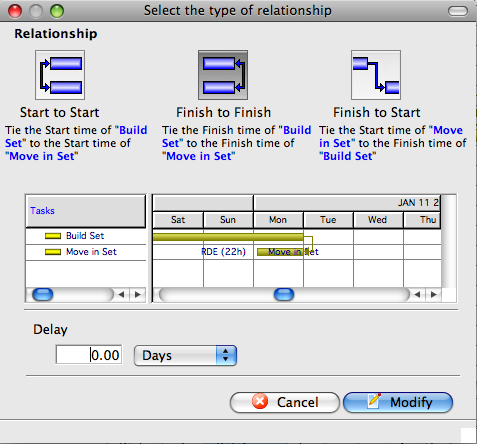
If you select Finish to Start, the starting time of one task is tied to the ending time of the other. In other words the starting time of the second task cannot start any earlier than the ending time of the first task.
Once these relationships have been set up, as you drag one task or the other in the Gantt chart, the same temporal (time-based) relations are maintained. Moving or changing starting or ending dates of one task may move or change dates on another task, based on the relationships you have set up.
A task can have relationships set up between any number of other tasks, but there can only be one relationship between any two given tasks.
With any items in this window, as soon as you leave a field or make a selection the information is saved and the screen is updated.
Adding and Deleting Task Suspensions
At this time, you can only have a single suspension of a task. If you need more than that, break the task down into multiple tasks.
To add a suspension to a task, you perform the following steps:
- Open the project by selecting it from the Project list. Then, in the Project window, click the Gantt
 button.
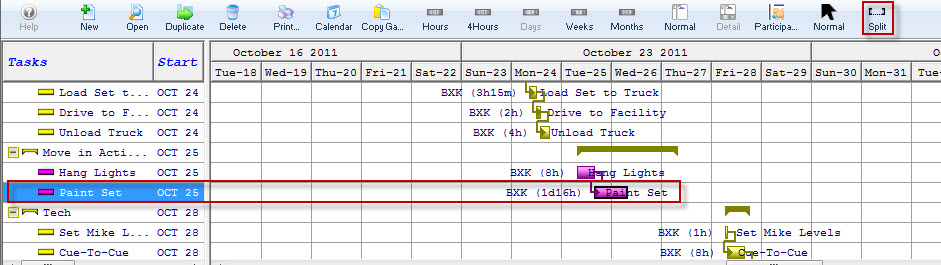
- In the Gantt Chart, highlight the task to be split. Use the right click context menu selection split
 or click the Split
  button on the toolbar / ribbon bar.
The edit details screen opens to the suspension tab.
The task information containing the details for the suspension is displayed on the left.
- Make any adjustments.
They are automatically reflected in the Gantt Chart and the date ranges on the left.
You can edit a suspension by editing the date/time for the starting or ending of the suspension or by clicking on the calendar and making your selection. You cannot enter dates/times outside the boundaries of the task itself.
Once a suspension has been created, you can drag the bounds of the suspension from within the Gantt chart.
With any items in this window, as soon as you leave a field or make a selection the information is saved and the screen is updated.
Delete the Suspension
To delete a suspension, you perform the following steps:
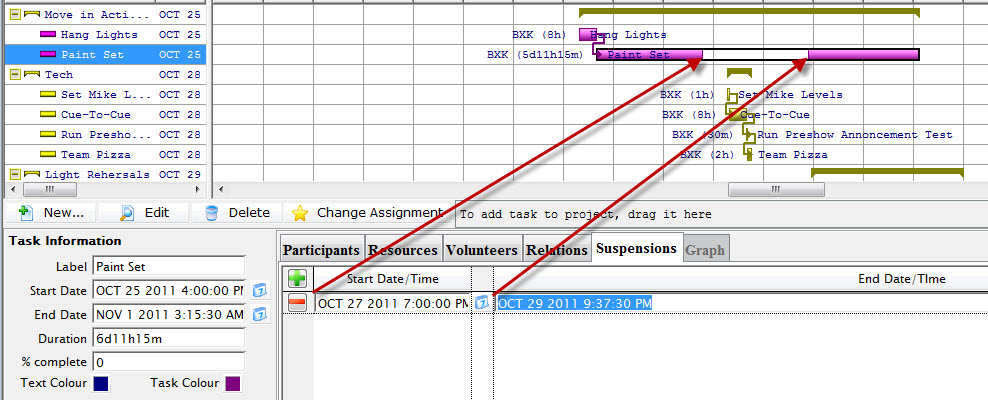
- Open the Gantt Chart and click on the suspension you want to delete.
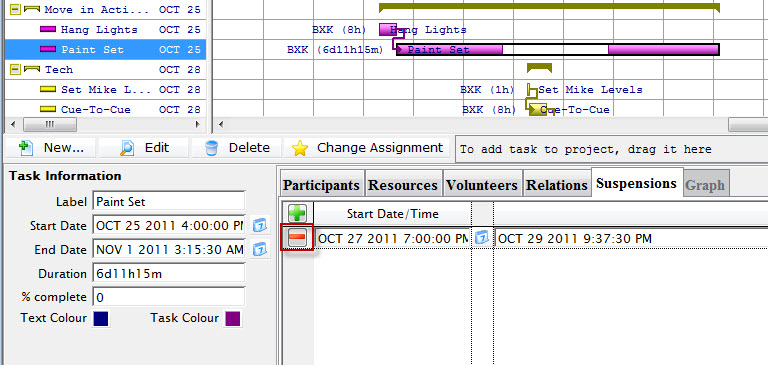
The Detail Editing subwindow opens to the suspension.
- Click the Remove
 button.
A confirmation dialog opens.
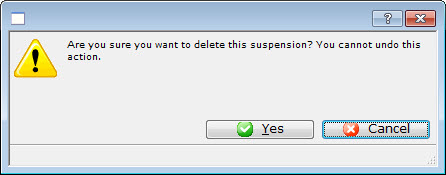
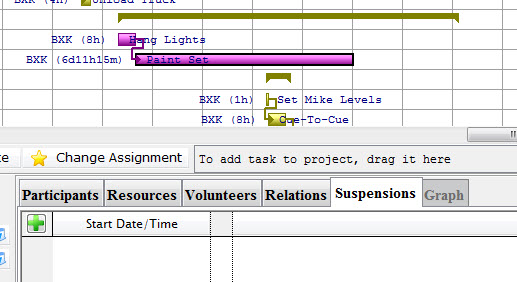
- Click Yes to remiove the suspension.
Graph
Graphing is not yet available.
Buttons and Dragging
Below the treelist and Gantt chart are a group of buttons and a drop area for tasks.
Description of the Button and Dragging Area
 |
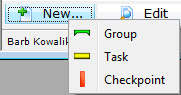
A Flyout menu opens where you can add:
| ||
 |
Edits the name of the task selected. | ||
 |
Removes the task or the group selected.
| ||
 |
Allows you to transfer tasks from one employee to another. Click here for more information. | ||
 |
If you want to add tasks to a project that have already been created elsewhere, you can drag them to the drop area. Click here for more information. |
New Button - Group
To Add a New Group, you perform the following steps:
- In the Projects window, click the New button.
In the example shown, I want to insert the New Group, after the group Rehersals.
- In the New flyout, click Group
 .
.
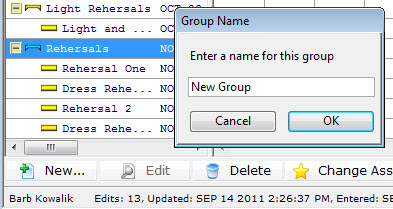
The Group Name Dialog opens.
Enter the name of your new group and click OK.
- You click and drag to right under the group Rehersals and you see the same ended line
, then let go.
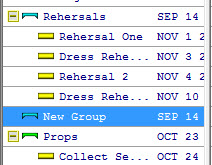
Your new group has been added.
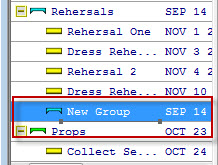
New Group is now a sub-group of rehersals. It needs to be at the same level as Rehersals.
New Button - Task
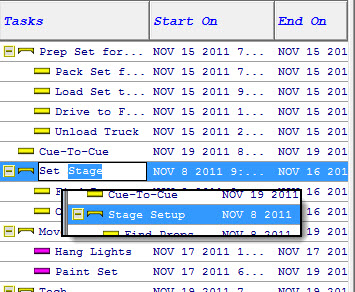
To Add a New Task, you perform the following steps:
- In the Projects window, click the New button.
In the example shown, I want to insert a New Task in the group New Group.
- In the New flyout, click Group
 .
.
The Group New Task window opens.
Click here to go to the Add New Task page.
Right Click Context Menus
Both the Treelist and Gantt chart areas have context menus associated with them. Right-click on the appropriate area to see it's context menu.
Treelist Context Menu
Click here for a description of all of the functions of the Treelist Context menu.
Gantt Chart Context Menu
Treelist Context Menu
Functions
| Preferences |
Hide / Show Toolbar - Toggles the Project window toolbar / ribbon bar Hide Toolbar / Show Toolbar - Toggles between displaying and hding the Calendar window toolbar. Hide Text / Show Text - Toggles between showing and hiding the text underneth the icons in the Calendar window toolbar. Small Icons / Normal Icons - Toggles between showing large or small icons in the Calendar window toolbar Retore Window Defaults - If you have moved any of the columns or changed the menu set up, Restore Defaults removes all your changes Set View - Not yet available |
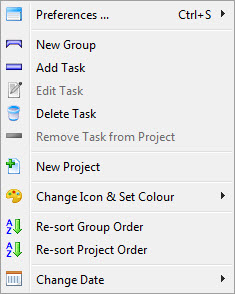
| New Group | Groups are used to assemble tasks together. Click this Item to add a new group. |
| Add Task | Tasks are the activities for your project. Click here for more information on adding tasks. |
| Edit Task | Opens the Task Detail window of the selected task for edititng. Click here for more information on editing tasks. |
| Delete Task | Deletes the selected task. |
| Remove Task from Project | Removes the selected task from the project, but not from the database. You can then add this task to another project. |
| New Project | Opens the new project inserting window. Click here for more information on setting up a new project. |
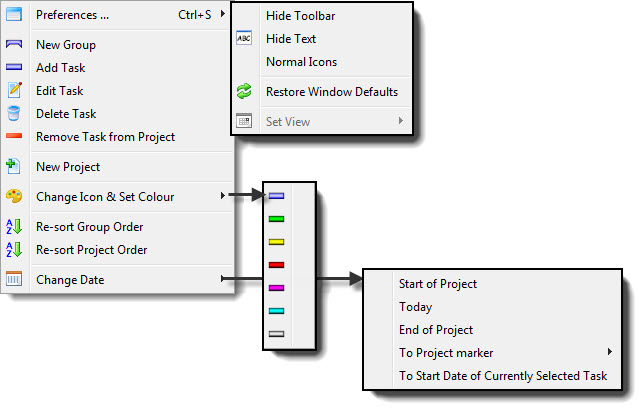
| Change Icon Set and Colour | 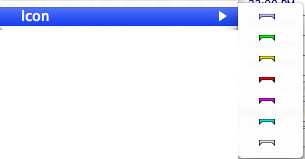 Allows you to change the color of the Icon for the selected group or task.
 |
| Re-sort Group Order | Re-sorts in date order, the items in the selected group. |
| Re-sort Project Order | Re-sorts all items in the project, in date order within their groups |
| Change Date | 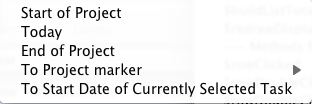 Change date lets you change the date within the Gantt chart. Choices are:
|
Gantt Context Menu
The right click context menu provides shortcuts to the most used tasks you perform in the Gantt Chart.
To view a description of all of the functions of the left side of the window - Tree List context menu - click here.
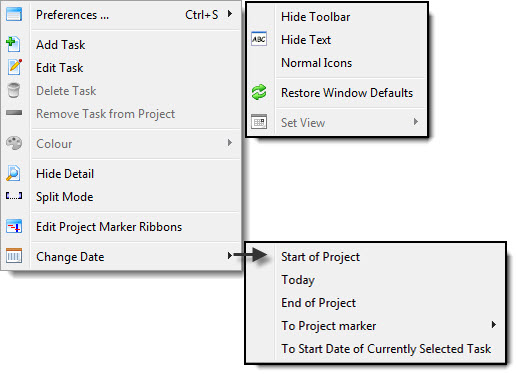
| Preferences |
Hide / Show Toolbar - Toggles the Project window toolbar / ribbon bar Hide Toolbar / Show Toolbar - Toggles between displaying and hding the Calendar window toolbar. Hide Text / Show Text - Toggles between showing and hiding the text underneth the icons in the Calendar window toolbar. Small Icons / Normal Icons - Toggles between showing large or small icons in the Calendar window toolbar Retore Window Defaults - If you have moved any of the columns or changed the menu set up, Restore Defaults removes all your changes Set View - Not yet available |
| Add Task | Tasks are the activities for your project. Click here for more information on adding tasks |
| Edit Task | Opens the Task Detail window of the selected task for edititng. |
| Delete Task | Deletes the selected task. |
| Remove Task from Project | Removes the selected task from the project but not from the database. You can then add this task to another project. |
| Colour | Allows you to change the color of the Icon for this group or task |
| Show / Hide Detail | Hiding the detail is the same as clicking on the Normal
window
icon on the toolbar and hides the detail task window below the treelist
and Gantt chart. |
| Split Mode | Split mode is the same as clicking on the Split
icon on the
toolbar and changes the cursor to Split mode. When in Split mode, click on
a task to create a suspension at that point. Click here for more information on adding suspensions. |
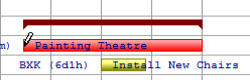
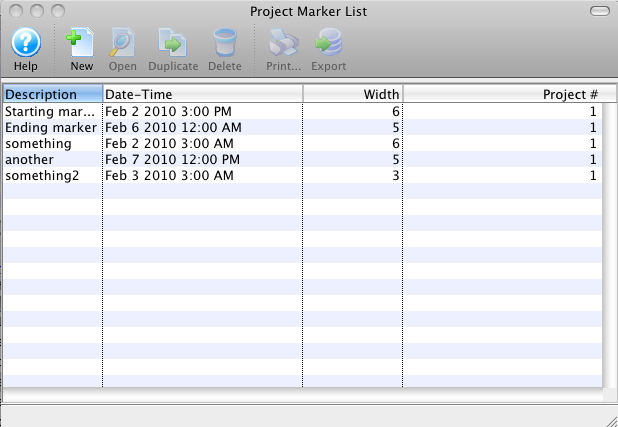
| Edit Project Marker Ribbons |
Displays a list of the current project markers, or checkpoint ribbons. These ribbons display a vertical ribbon on the Gantt chart at a given date/time and in a colour of your choosing. From the list you can add, open, duplicate, or delete a ribbon. Click here for more information on Project Marker Ribbons. |
| Change Date | Change date lets you change the date
within the Gantt chart. Choices are:
|
Project Markers
You can move to the Start of Project, Today, End of Project, To Project marker (project markers will be listed in a submenu), or To Start Date of Currently Selected Task.
You can also Edit Project Marker Ribbons. This displays a list of the current project markers, or checkpoint ribbons. These ribbons display a vertical ribbon on the Gantt chart at a given date/time and in a colour of your choosing. From the list you can add, open, duplicate, or delete a ribbon.
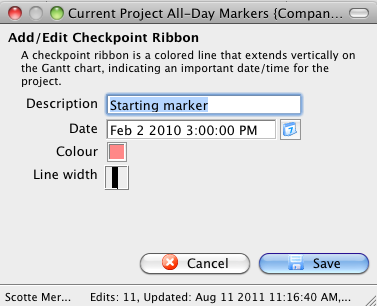
When you add or open a ribbon, the detail screen opens where you can enter a description and date (both required) and select a colour and width for the ribbon.
 Page in process of being updated