Merging Map with Pick-Your-Seats
|
Before doing this process, you must have created your SVG map and have it available or already have it imported. |

The merging maps process is required before you can enable pick your own seats online. It takes a previously created SVG map and automatically adds in the seat locations, tooltips, and the customized code that will make the maps work online
There are 4 steps:
- Import the SVG map into the Theatre Manager pricing map
- Set up or change the tooltip format to assist the Patron making a purchase online.
- Use the Place Seats SVG Map Wizard to merge in seat locations and tooltips to make the final map for pick your own online
- Previewing the SVG map and then testing it with online sales
|
You can repeat this process as many times as you want. It is usually just a click of a button and you will need to do it:
|
Importing SVG Map
To do this:
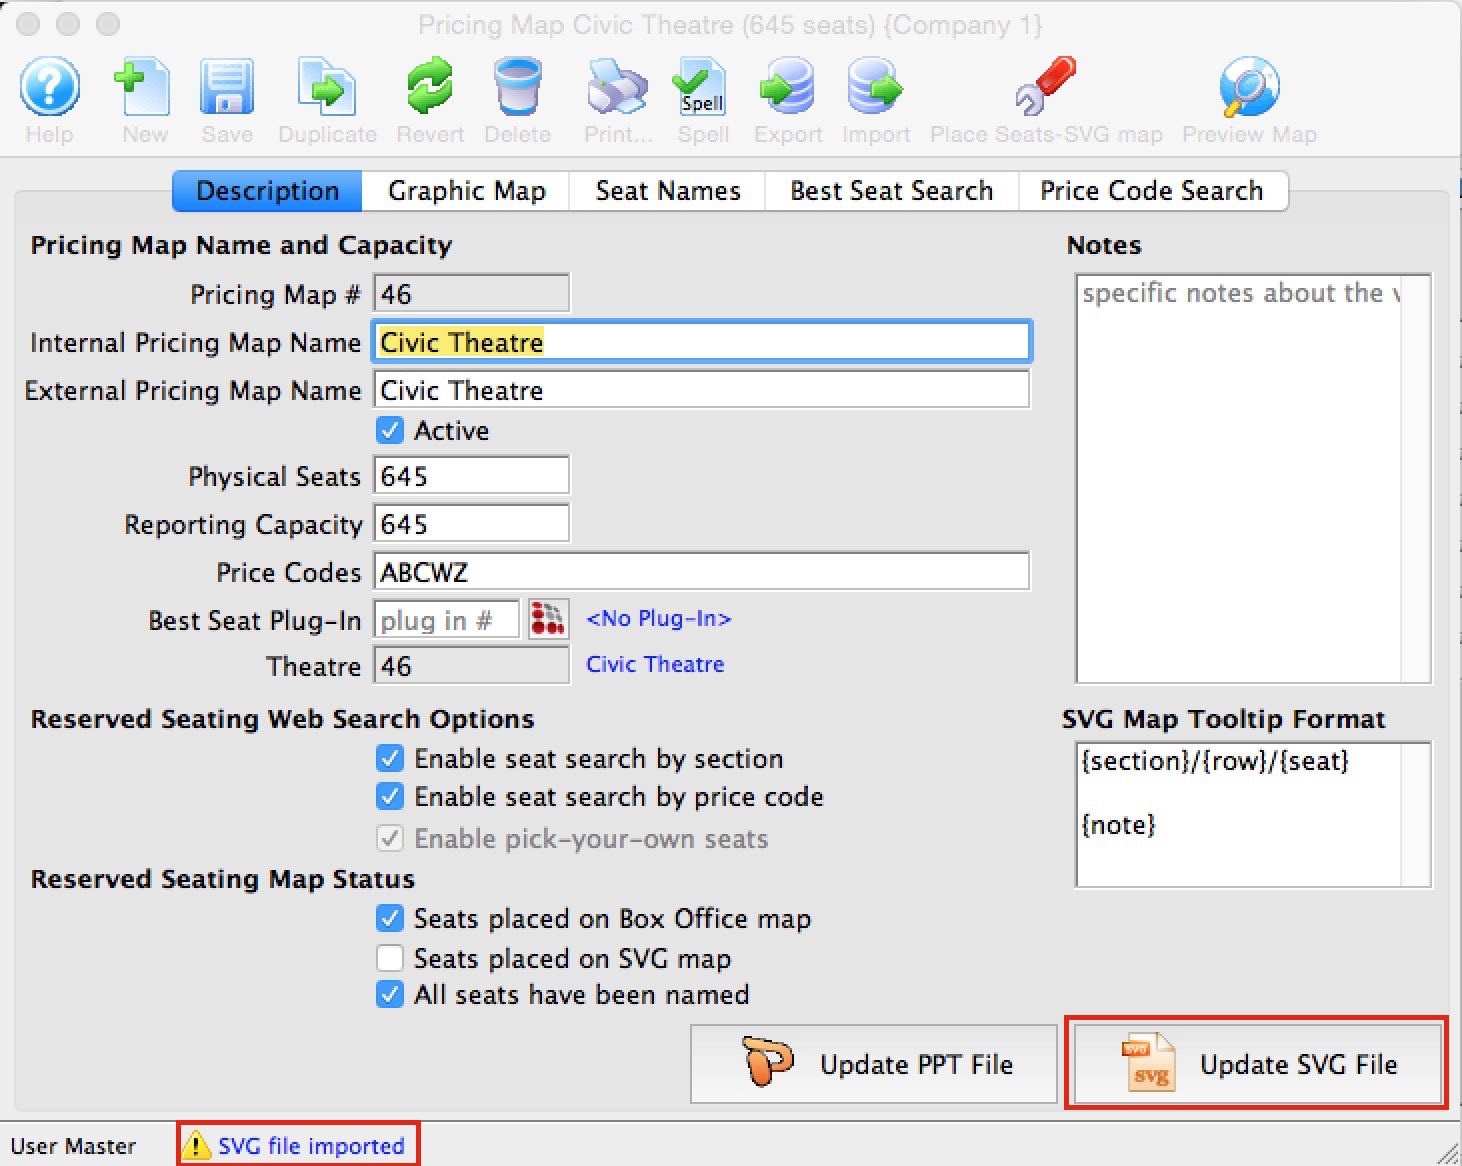
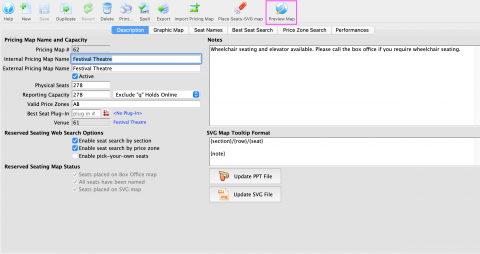
- Select the 'Description' tab on the Pricing Map editing window.
- Click on your SVG document
- Drag it on top of the button that will either be labelled 'Import SVG File' or 'Update SVG File' as indicated below
- Release the mouse
- If the message at the bottom of the screen indicates 'SVG file imported', you have completed the first step.
Set seat-tip Format for SVG Map
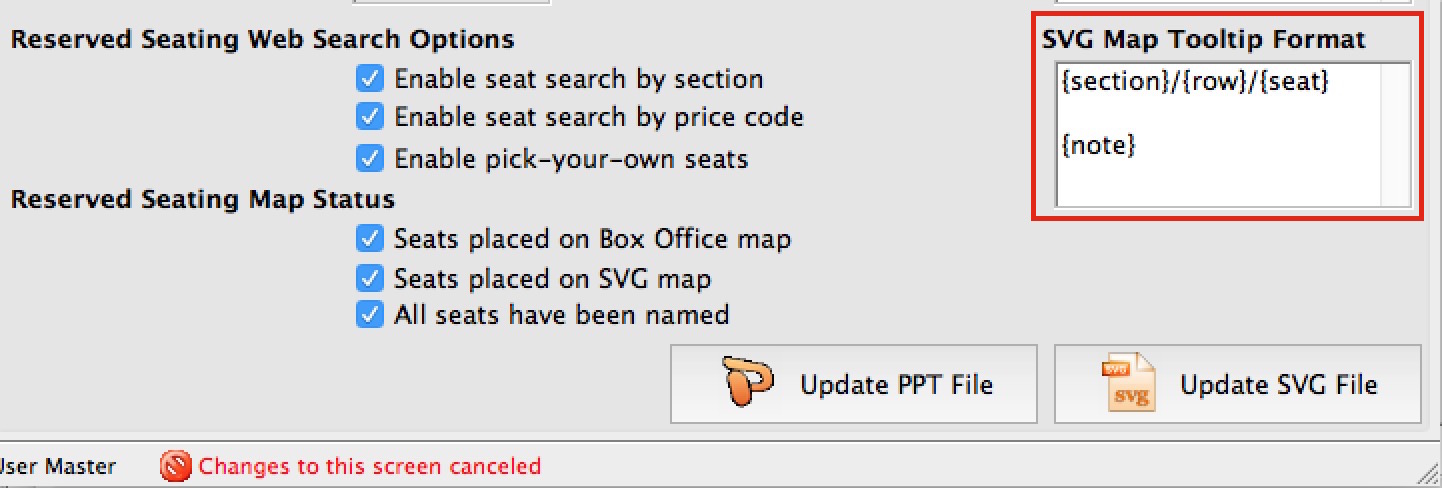 The example to the right causes the online map to show the {section}/{row}/{seat} and two lines below that, the seat {note} (if one exists).
To edit this field, simply type how you want the seat tip to look and which fields you want. You may use keywords, fixed text, and newlines to make it look as you wish such as:
- One or more of the following key words, in any order, which will be replaced by the actual values on each seat. Note: the { } are required and bolding was used for clarity only:
- {door} - adds the door description used for entry into the tip
- {section} - adds the section description to the tip
- {row} - adds the row into the tip
- {seat} - adds the seat number into the tip
- {notes} - adds the special seat notes to the tip - but only if the 'use' column in the seat names is set to 1
- {logical} - adds the logical seat number to the tip.
- Any standard text that you want which might assist the user. For example the tip can look like:
- {section} - {row} - {seat}
- Section: {section} Row: {row} Seat: {seat} Patrons should enter by door {door}
- Area: {section} Table #: {row}
- You can also add new lines if you want some data on separate lines
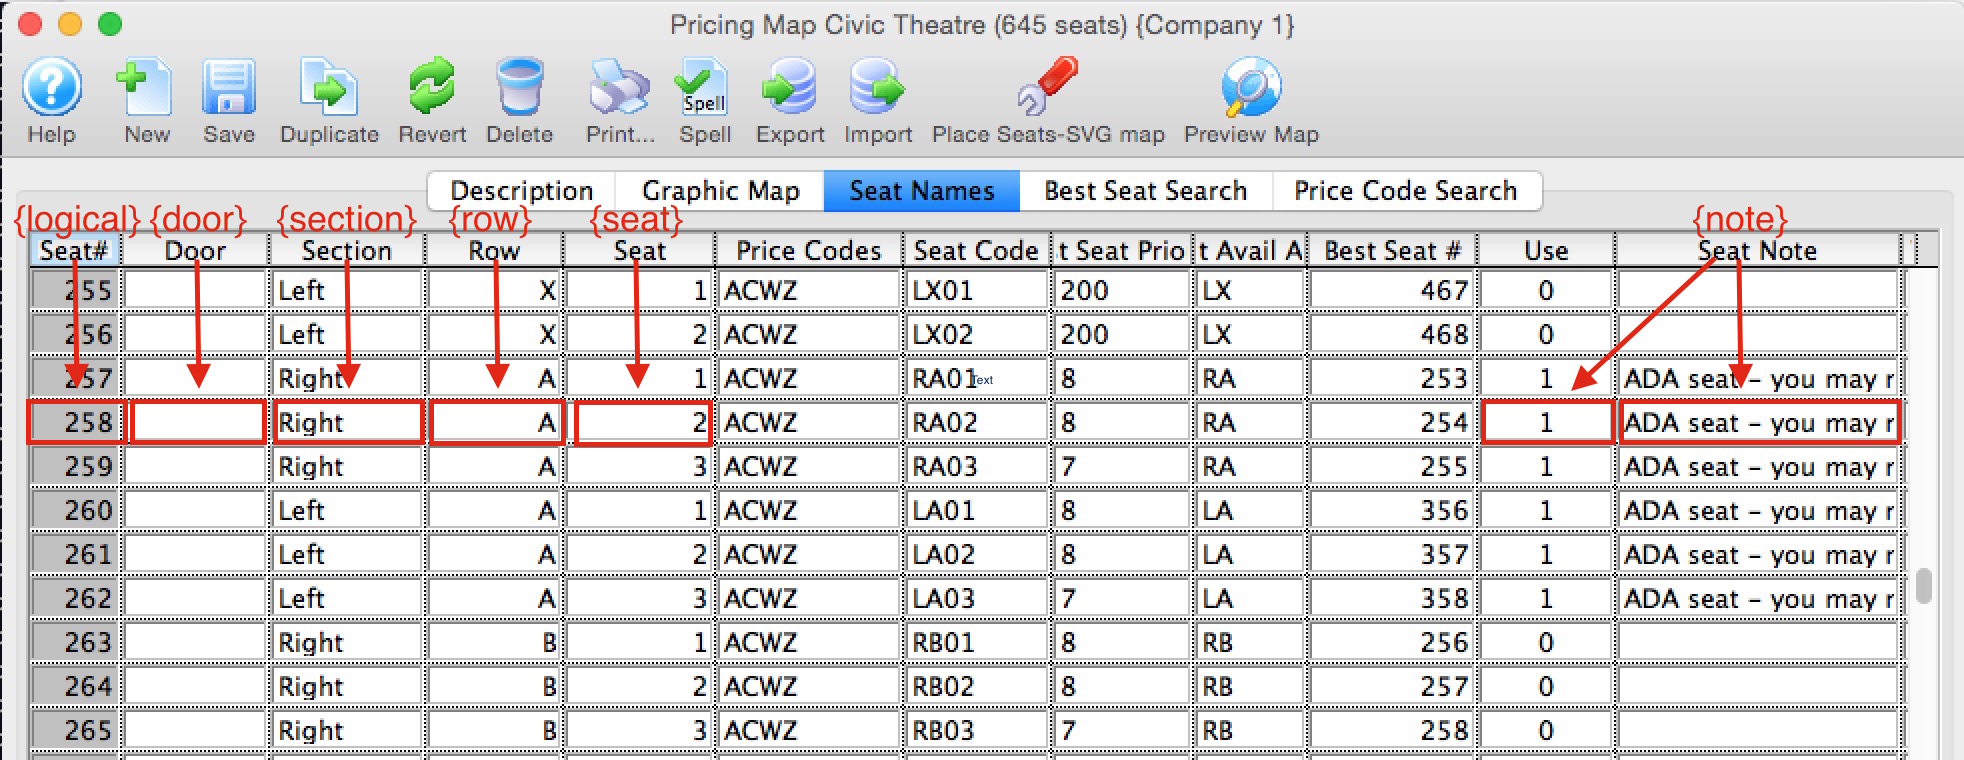
The diagram below shows how the seat tip fields relate to the columns on the Seat Names tab.
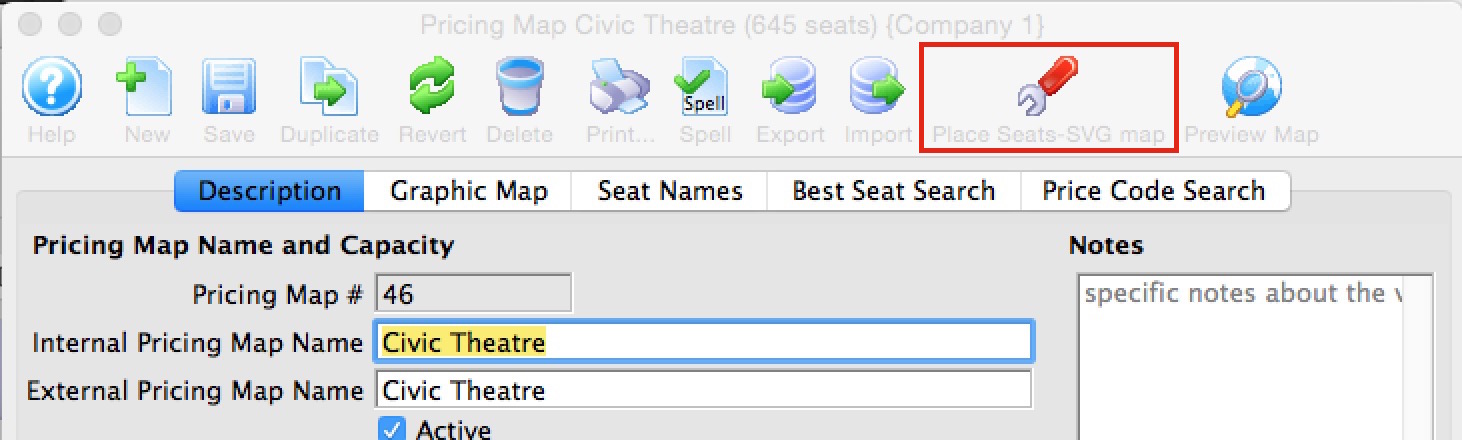
Place Seats SVG map Wizard
After preparing the SVG map per the previous instructions, you will need to use this wizard to merge the map with the rest of the programming code that will actually make it work. Fortunately, this is automated and is a quick process.
- Click the Place Seats SVG Format button on the toolbar to start the process. If you cannot, then make sure you have imported an SVG map .
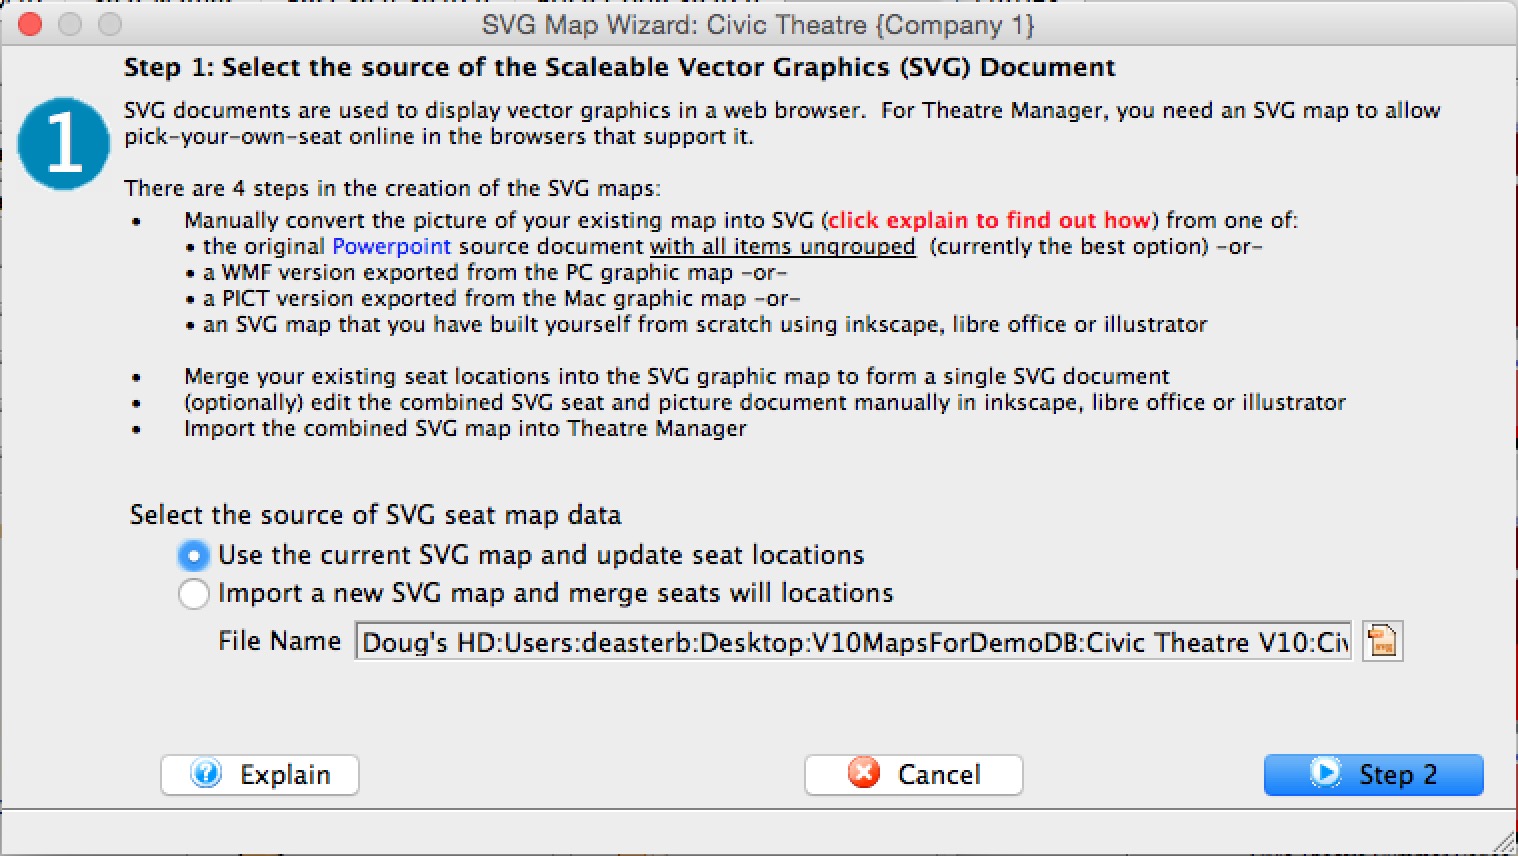
- The first step in the wizard asks you where to get your SVG map from. You can either:
- Use the SVG map that you have already imported into TM. If you select this option, it will replace all seat locations and seat tips in the existing map. This option may be best if all you are doing is changing seat tips, seat names, or have moved some seats on the graphic map.
- Specify the file name of the SVG graphics file and import a fresh copy prior to merging in the seat locations and tooltips. This option is better if you have completely edited or changed colours or background on the map and have made a new SVG file.
- Click Step 2 when ready to continue
-
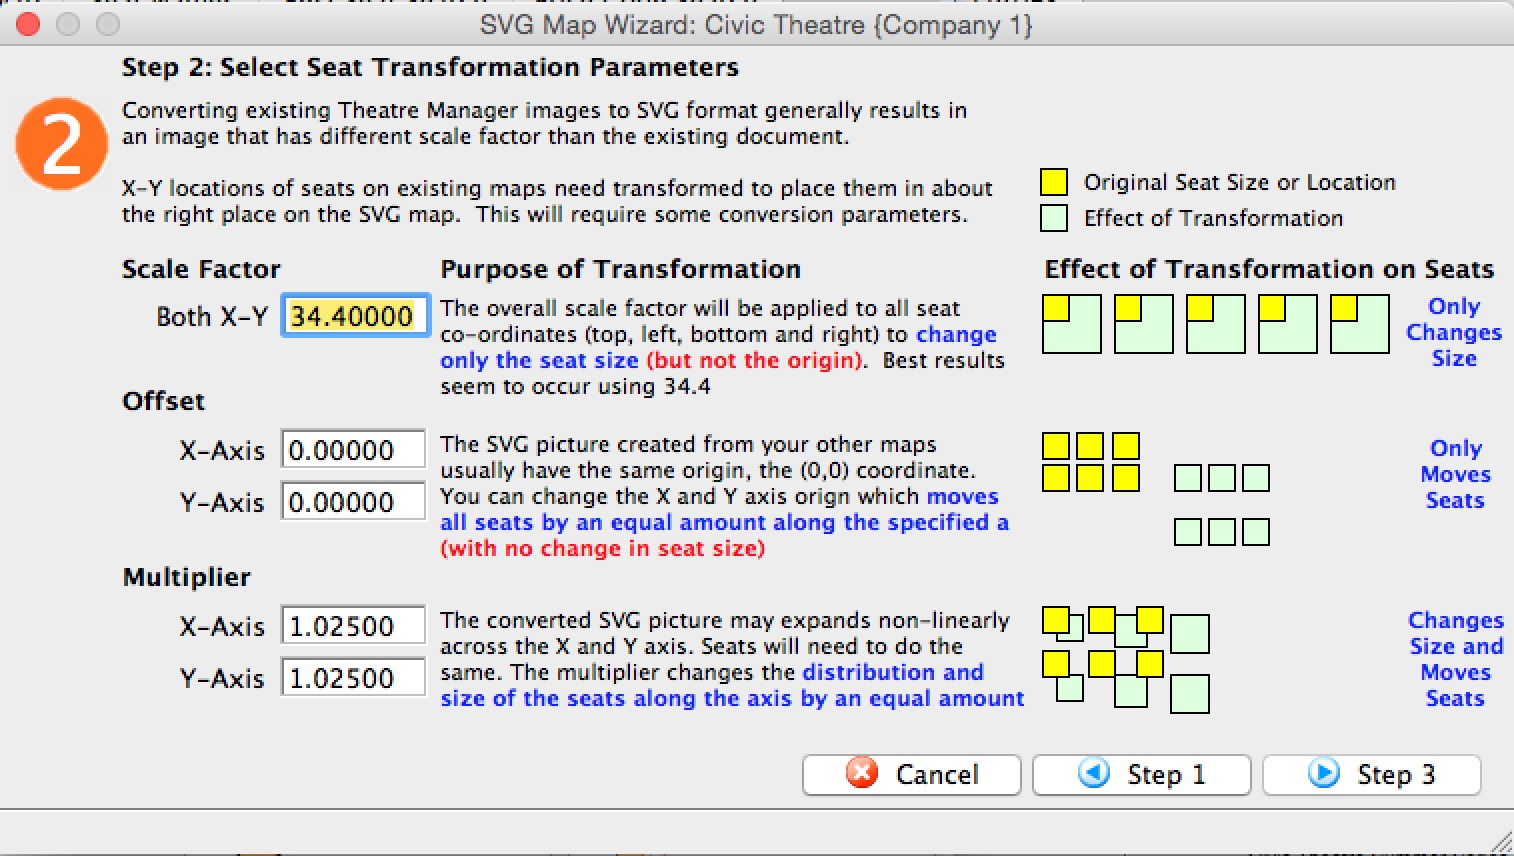
The second step copies the seating locations of the graphic map used for box office and automatically transforms existing seat locations so that they can be used with the SVG map.
Historically, different vector based image formats for the web use different scaling and origins. This means that X-Y seat locations for the box office maps have to be 'adjusted' slightly to work with the SVG map. This window shows the standard values that have been found to work with almost all powerpoint maps so far (providing that they have been cleaned up of a couple of things). If you are using an SVG exported from Powerpoint, you should not have to change any of these parameters - but in case you find you need to (eg: an export from Adobe Illustrator), the meaning of them are:
- Scale Factor (default is 34.4). Each seat on the map has a top-left and bottom-right X-Y position on the background image. The scale factor multiplies each X or Y position by the fixed amount to make seats 'bigger' but leave the origin of the seats the same. In other words, seats will not move - just get bigger to match the SVG background. (From customer reports, Adobe's setting may be 1.0 - meaning don't multiply)
- Offset (default 0.0). All maps and seats should start at the same origin, typically the 0,0 co-ordinate. If you want to move every object by the same amount in the X and/or Y direction, provide a value for the offset. This simply moves seats one way or another. It does not affect size or shape.
- Multiplier (default 1.025). This transformation is applied after the previous two. All seat co-ordinates are multiplied by the factors to stretch the seat locations out a little in the X and/or Y directions. (from customer reports, Adobe's setting is 1.0)
- Click Step 3 when ready to continue
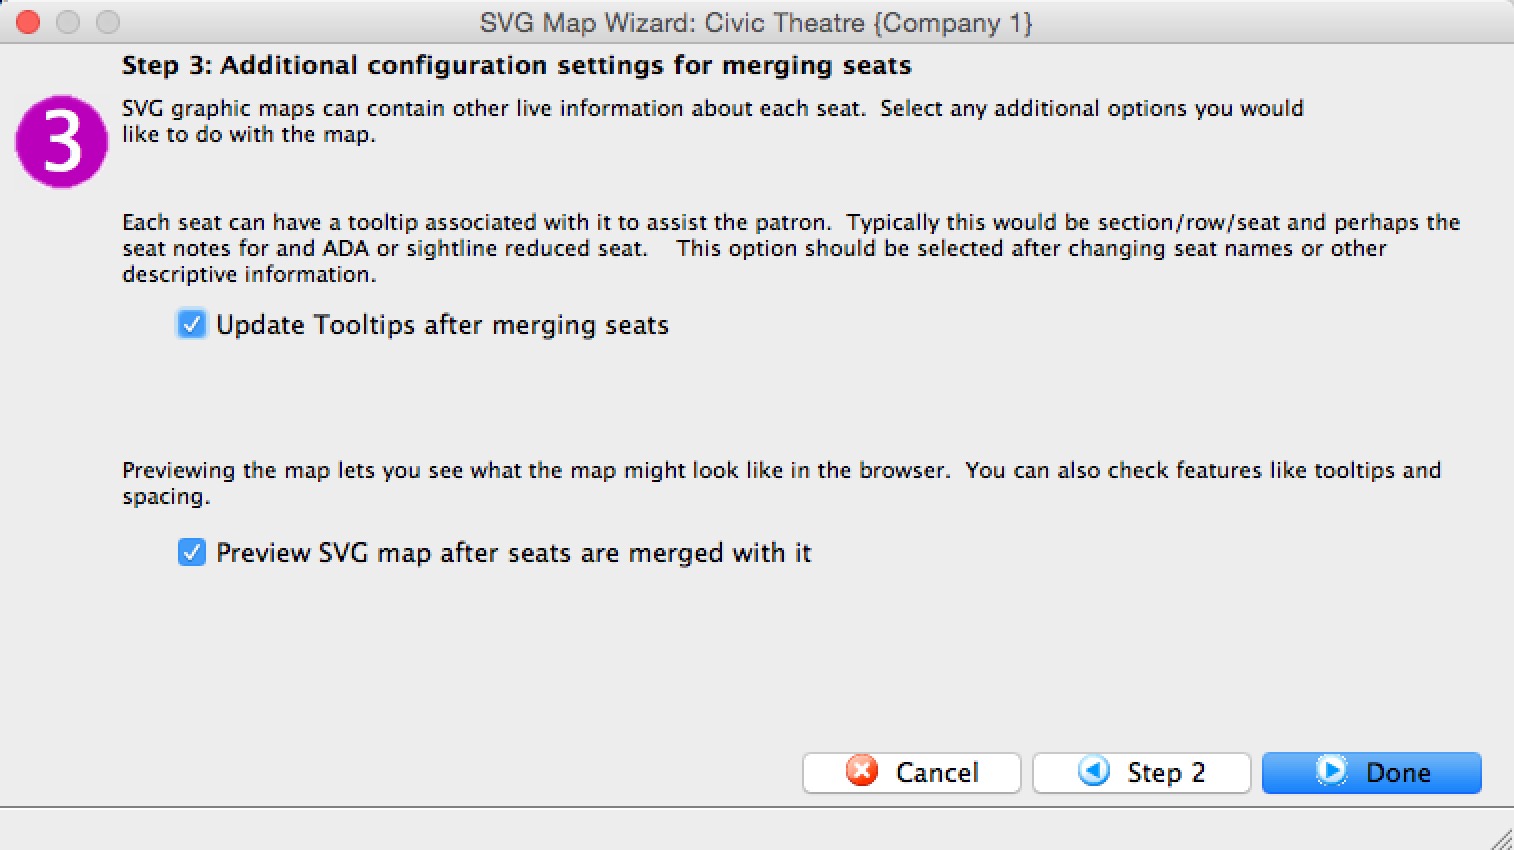
- The online maps have some customer assistance capabilities that can be added in. Select the ones you wish:
- Seat tips can be displayed when a patron hovers over a seat, or they can be left off the map.
- Indicate if you want to see a preview of the map after completing the process. It will open in your browser and you can interact with it by stretching it or trying the tooltips
- Click Done when ready to continue
Testing An SVG Map Online
The Preview Button
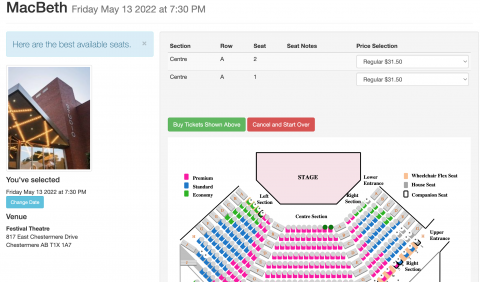
After you have placed your seats on the Pricing Map, you can quickly Preview the Map Online by selecting the Preview Map button. This will jump you to the view of what patrons see online, and the preview displays the TM seats placed on the SVG file.
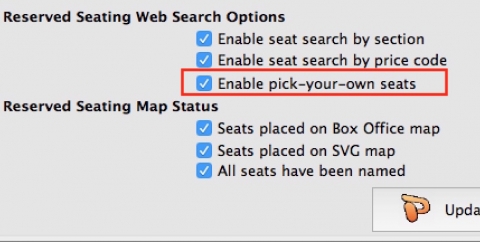
Enabling the Pick Your Seat Option
The online select-your-seat process has predefined computer code associated with each seat and it can be turned on in the Description tab of the Pricing Map itself.
Testing online sales
You can test the online sales process by previewing the Event online, and running through the sales process. You can test all the Promotions, move from seat to seat, and test on mobile devices to ensure that the Map can be pulled and pinched the way you need it in terms of sizing.