Printing the Chart
Printing the Chart
- To start, click the Print
 button in the Project Detail Toolbar / Ribbon Bar.
Your operating system print dialog opens.
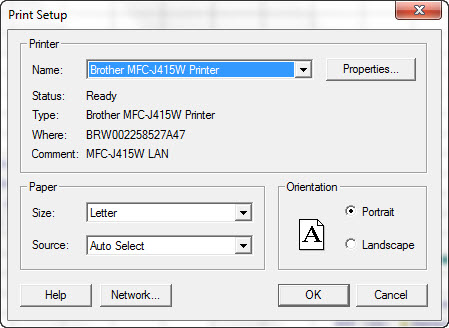
- Click the OK button.
The Gantt Representation of Project Criteria window opens.
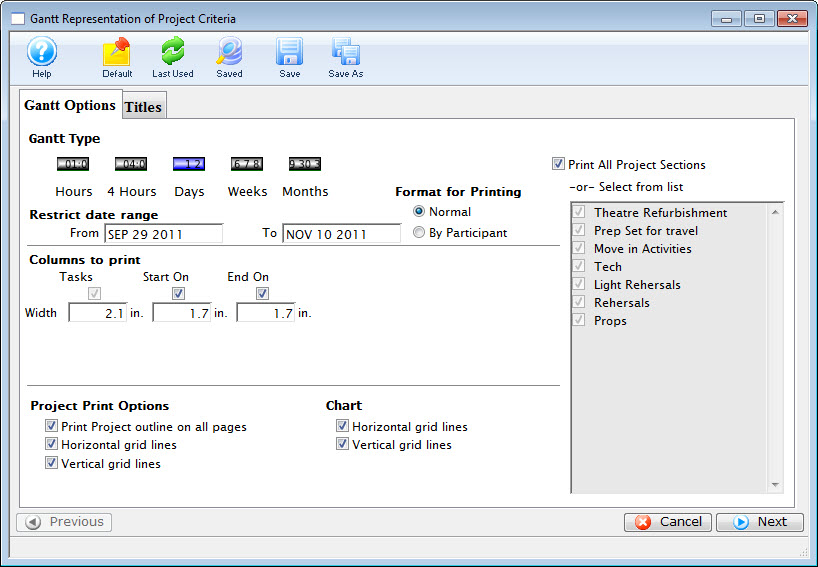
Click here for more information on the options available.
- Review and select the appropriate options. When complete, click the Next
 button.
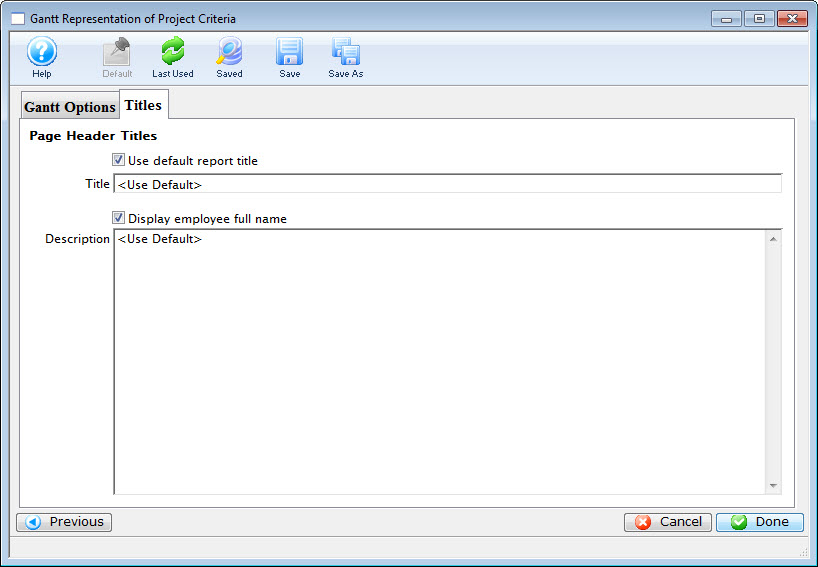
The Title tab opens. Click here for an explanation of this tab.
- Click the Done
 button.
This generates the selected report and opens the Finished Report window.
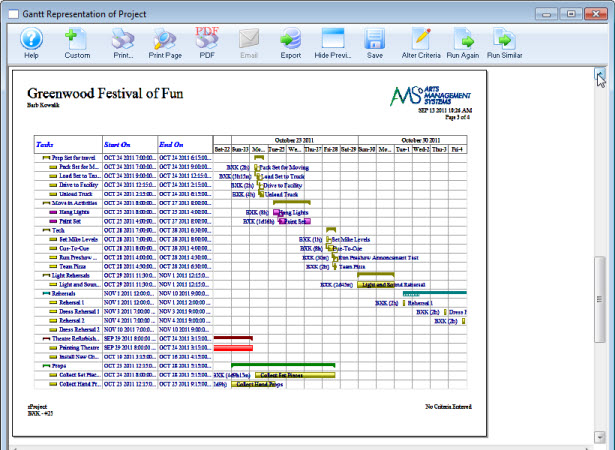
Click here for more information on the Finished Reports window.
Gantt Printing Options
Gantt Printing Options
Parts of the Gantt Options Tab
| Gantt Type | You have the option of selecting:
|
| Restrict Date Range | Enter a Date in the From and the To boxes to change the date range. The default is the start and the end dates of the project. |
| Print All Project Selections | The default is to print all of the Groups you have
defined in your project. To print specific groups only,
Disable the checkbox  .
You can then select the groups you want from the list. |
| Columns to Print | This option diplays the columns you selected in the tree list. You can enable or disable specific columns and you can change the width of the columns. |
| Project Print Options | Disabling and enabling the checkboxes allows you to print:
|
| Chart | Disabling and enabling the checkboxes allows you to printt:
|
 |
Cancels the printing of the report |
 |
Next moves to the Titles tab. |
 - Prints the whole project in 1 hour increments.
 - Prints the whole project in 4 hour increments.
 - Prints the whole project in 1 day increments (Default).
 - Prints the whole project in 1 week increments.
 - Prints the whole project in 1 month increments.