Sales Summary Analysis (Daily)
 |
Daily Sales summary reports are simply a summarization of all financial transactions aggregated on a daily basis. They show a summary breakdown of sales, exchanges and refunds for:
|
 |
These reports should match GL reports when compared using the DAILY SALES DATE with the G/L HEADER DATE - JOURNAL DATE (not G/L Header Date - Posted). |
Sales Detail - Y.T.D. Comparison
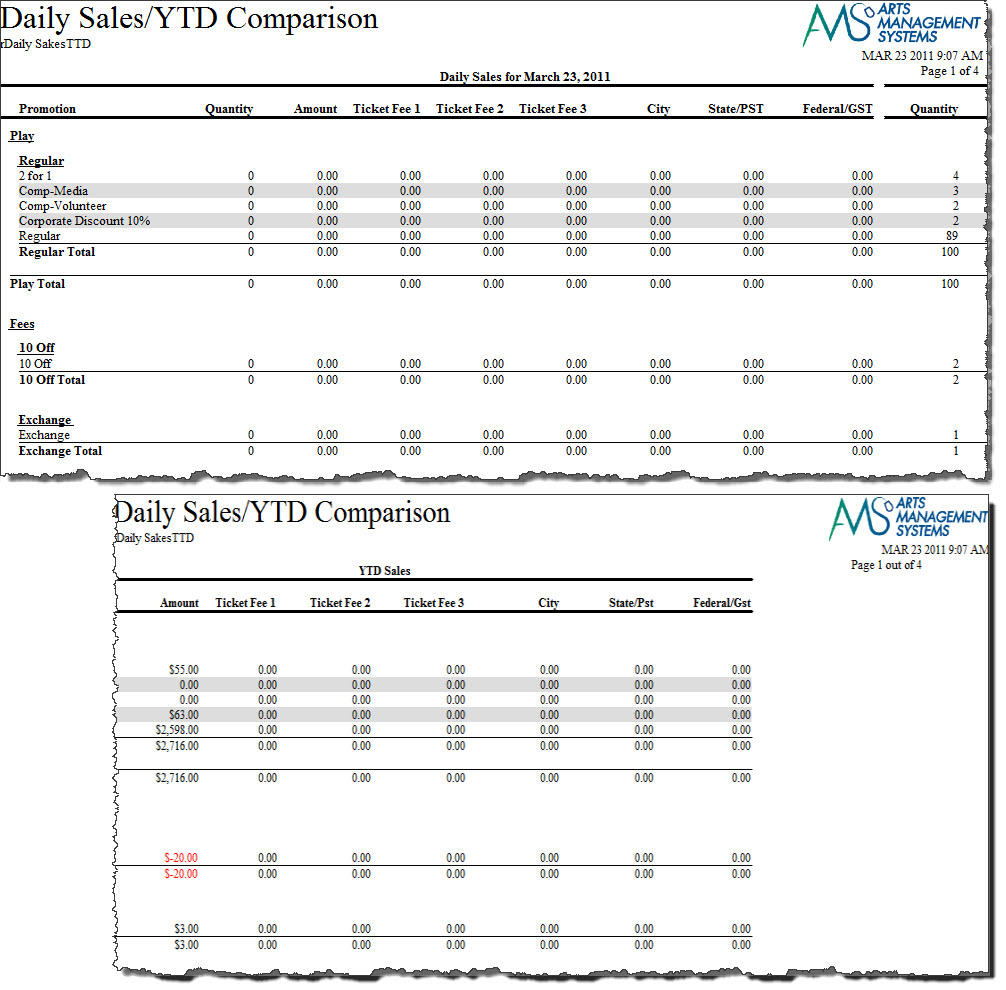
The Sales Detail - Y.T.D. Comparison report can be found under the Sales Summary Analysis category.
- Click here for information on generating a report.
- Click here for information on the Finished Report window. This report has additional criteria options.
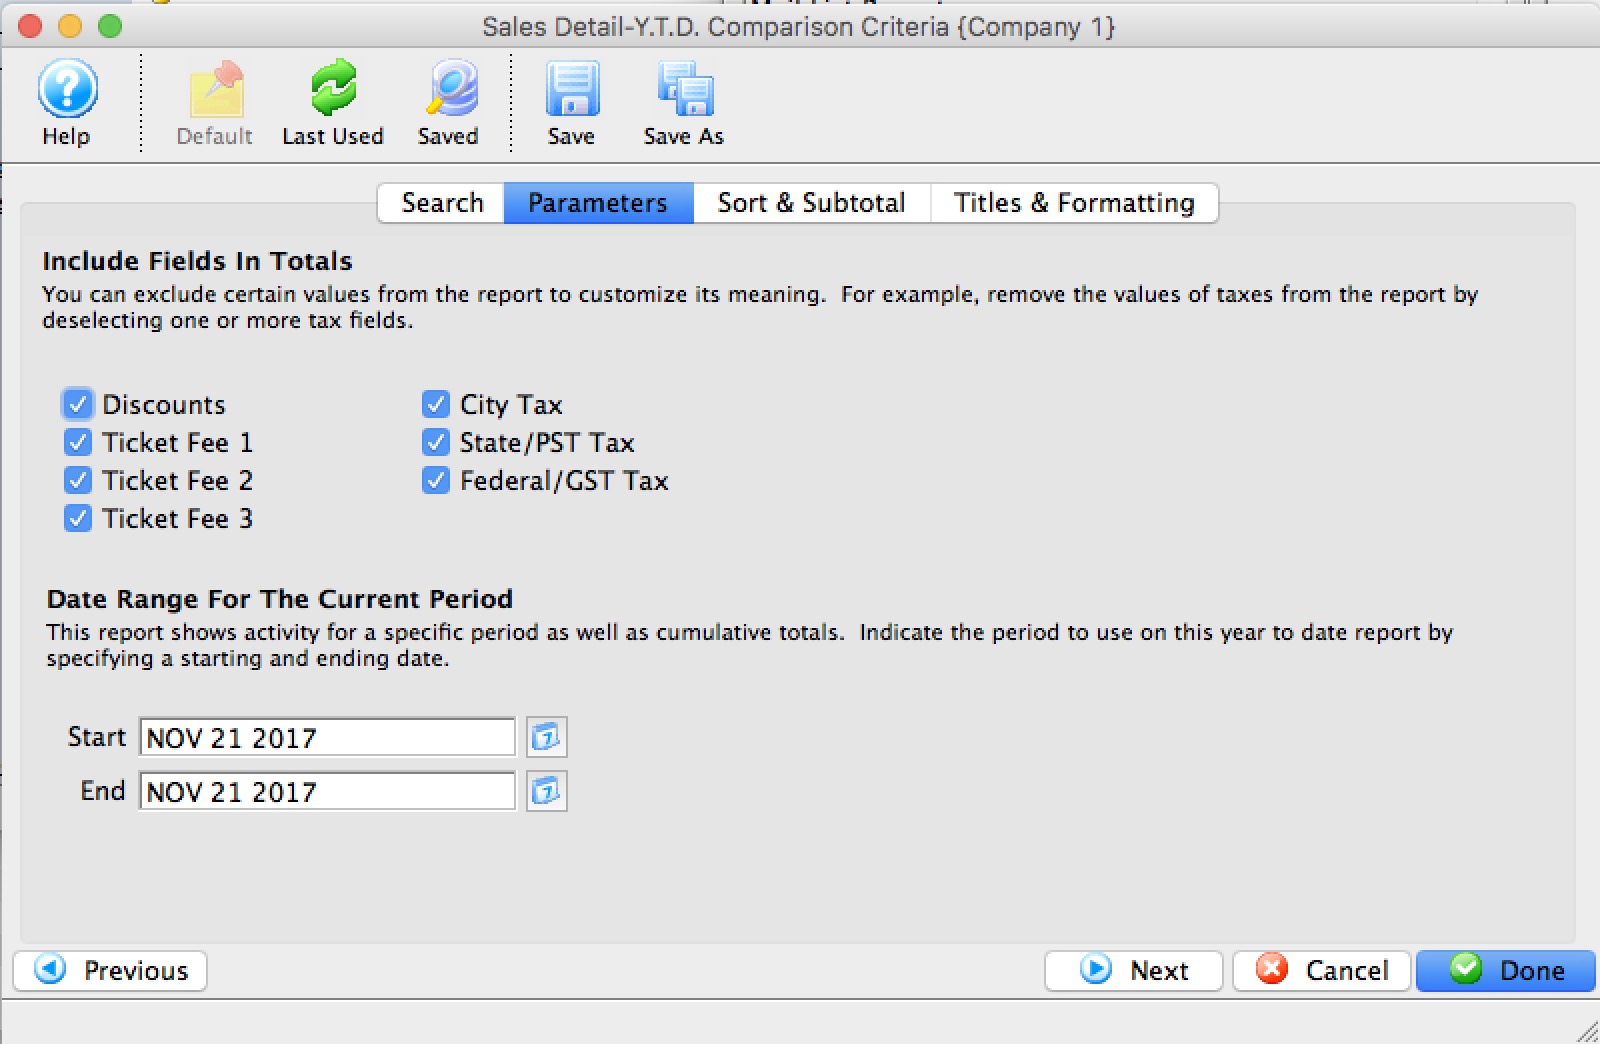
- Click here for more information about the Parameters tab.
One of the tabs is the report parameters - and the key information is the date range at the bottom which signifies the current range for the report to compare to the YTD range.
- Click here for more information about the Sort & Subtotal tab.
- Click here for more information about the Formatting tab.
Purpose of the Report
This report generates a comparison listing between sales for the given fiscal years.
Departments Who Benefit From This Report
| Box Office | Use this report to see how types of sales are doing compared to the same time frame last year. |
| Marketing | Use this report to see how types of sales are doing compared to the same time frame last year. |
| General Manager | Use this report to see how types of sales are doing compared to the same time frame last year. |
Criteria Hints
It is recommended that this report use the date range settings on the Parameters tab of the Add Criteria window.
Sales Detail
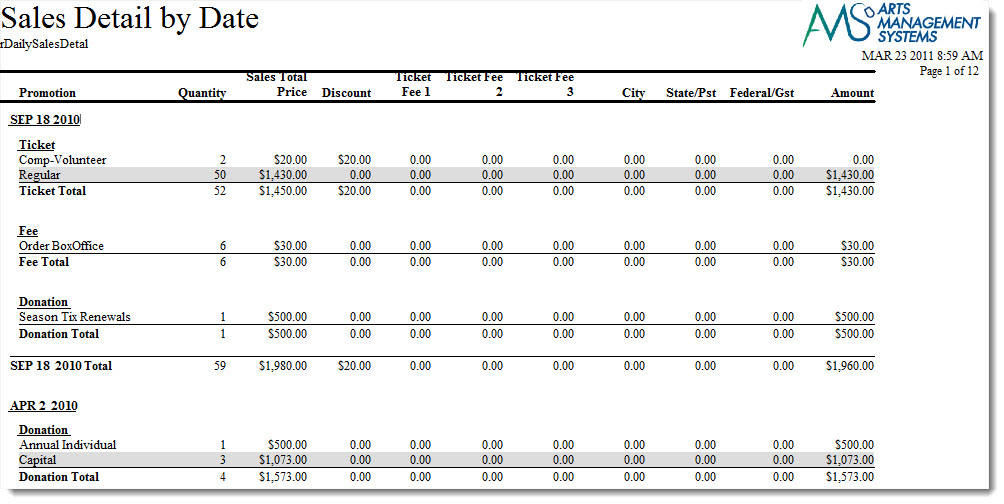
The Sales Detail by Date report can be found under the Sales Summary Analysis category. Below the image are detailed notes to help you in using the report.
Click here for information on generating a report. Click here for information on the Finished Report window.
This report has additional criteria options. Click here for more information about the Parameters tab. Click here for more information about the Sort & Subtotal tab. Click here for more information about the Formatting tab.Purpose of the Report
This report generates a listing of sales for a given day by type and promotion.
Departments Who Benefit From This Report
| Box Office | Use this report to review that types of sales that were done on a certain date. |
Criteria Hints
It is recommended that this report be run witha date or range of dates as the criteria.
| Parameter Field | Condition | Value |
| Daily Sales Date | between | (Date) and (Date) |
Sales/Exchanges/Refunds - Y.T.D. Comparison
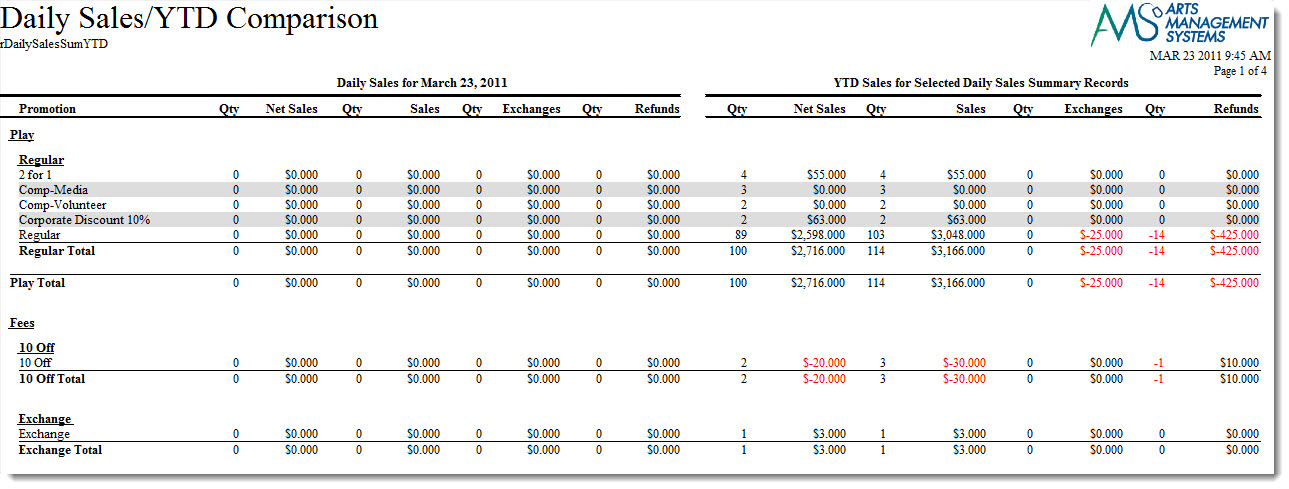
The Sales/Exchanges/Refunds - Y.T.D. Comparison report can be found under the Sales Summary Analysis category. Below the image are detailed notes to help you in using the report.
- Click here for information on generating a report.
- Click here for information on the Finished Report window. This report has additional criteria options.
- Click here for more information about the Parameters tab.
One of the tabs is the report parameters - and the key information is the date range at the bottom which signifies the current range for the report to compare to the YTD range.

- Click here for more information about the Sort & Subtotal tab.
- Click here for more information about the Formatting tab.
Purpose of the Report
This report generates a comparison listing between sales, exchanges, and refunds for the given fiscal years.
Departments Who Benefit From This Report
| Box Office | Use this report to see how types of sales are doing compared to the same time frame last year. |
| Marketing | Use this report to see how types of sales are doing compared to the same time frame last year. |
| General Manager | Use this report to see how types of sales are doing compared to the same time frame last year. |
Criteria Hints
It is recommended that this report use the date range settings on the Parameters tab of the Add Criteria window.
Sales/Exchanges/Refunds
The Sales/Exchanges/Refunds by Date report can be found under the Sales Summary Analysis category. Below the image are detailed notes to help you in using the report.
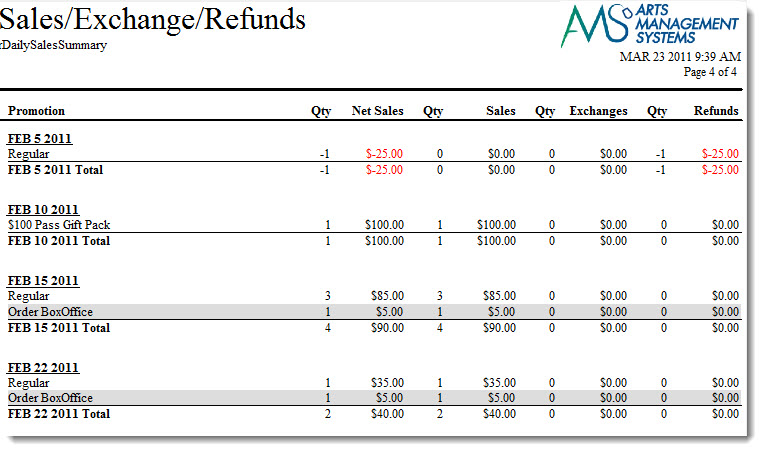
Click here for information on generating a report. Click here for information on the Finished Report window.
This report has additional criteria options. Click here for more information about the Parameters tab. Click here for more information about the Sort & Subtotal tab. Click here for more information about the Formatting tab.
Purpose of the Report
This report generates a listing of sales, exchanges, and refunds for a given day by type and promotion.
Examples of when to use this Report
This report is most helpful when cancelling an event that requires refunds or exchanges of tickets into another event. The report can be used as an overview of the organizations cashflow. There are various means to sort the data by:
- Promotion
- Promotion Type
- Play/Event
- Play/Event Promotion
- Play/Event Promotion Type
- Sales Summary Category
- Date of Sale
Departments Who Benefit From This Report
| Box Office | Use this report to review that types of sales, exchanges, and refunds that were done on a certain date. |
Criteria Hints
It is recommended that this report be run with a date or range of dates as the criteria.
| Parameter Field | Condition | Value |
| Daily Sales Date | between | (Date) and (Date) |