Graphic Map by Performance
The Graphic Map by Performance report is found under the Attendance for House and Calendar Reports category.
Click here for information on generating a report. Click here for information on the Finished Report window.
Purpose of the Report
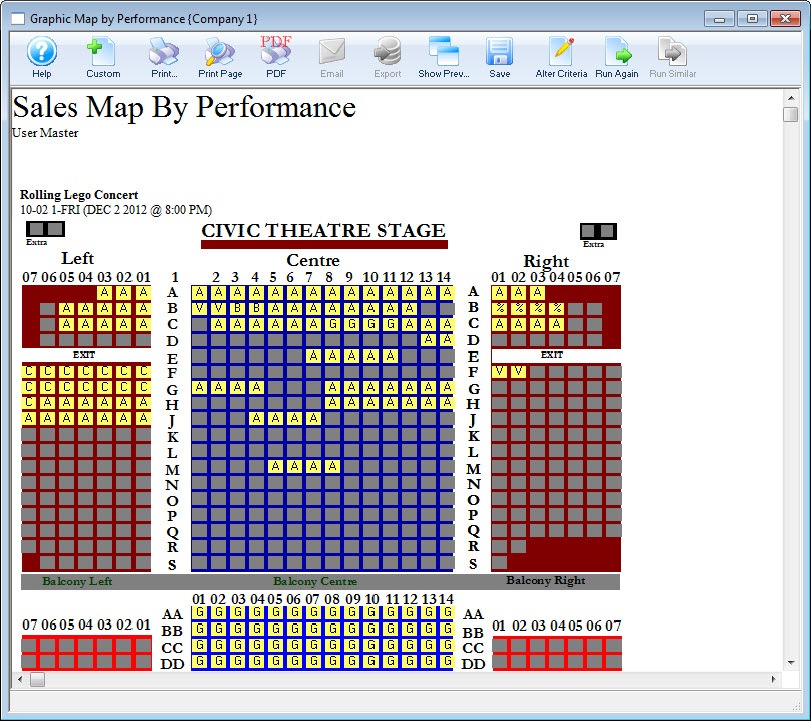
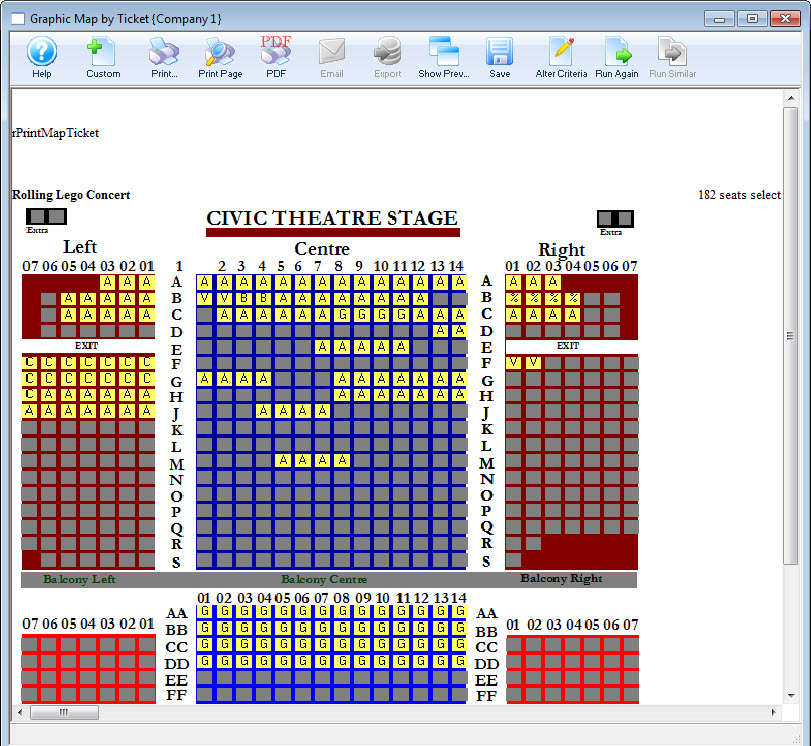
This report generates a graphical map of a reserved performance showing sold seats for ALL tickets, held, and unsold seats. Sold seats are denoted by either Price Code or Promotion depending on system setup.
Departments Who Benefit From This Report
| Box Office | This report can help Front of House allocate Seats on a last minute rush basis. |
| House Management | Use this report to see the empty seats in the theatre and assign patrons properly. |
| Marketing | Use this report to see areas of the venue that need more patrons and adjust marketing accordingly. |
| Stage Management | Use this report to let actors know where the heavy concentrations of audience members will be for the performance. |
Criteria Hints
It is recommended that this report be run using only one performance as the criteria.
| Parameter Field | Condition | Value |
| Event # | is one of | (Event Title) |
| Performance Date | = | (Date) |
| Performance Time | = | (Time) |
Print Graphic Map by Performance Report from Event
This report is most commonly printed from within the Play / Event.
To run this report from a Play / Event, you perform the following steps:
- From the main Theatre Manager toolbar / ribbon bar, click the Play
 button.
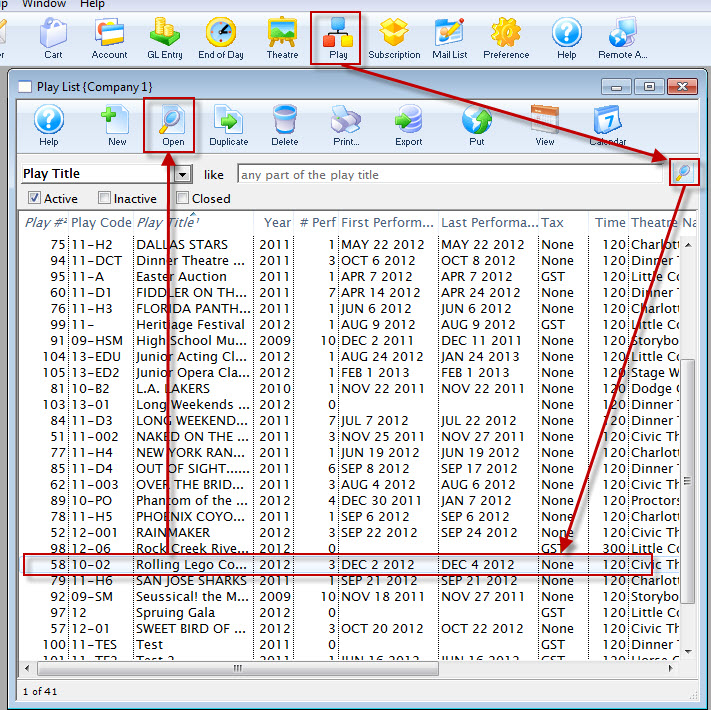
The Play List window opens.
- Open the Play / Event.
Click here for more information on Finding Events.
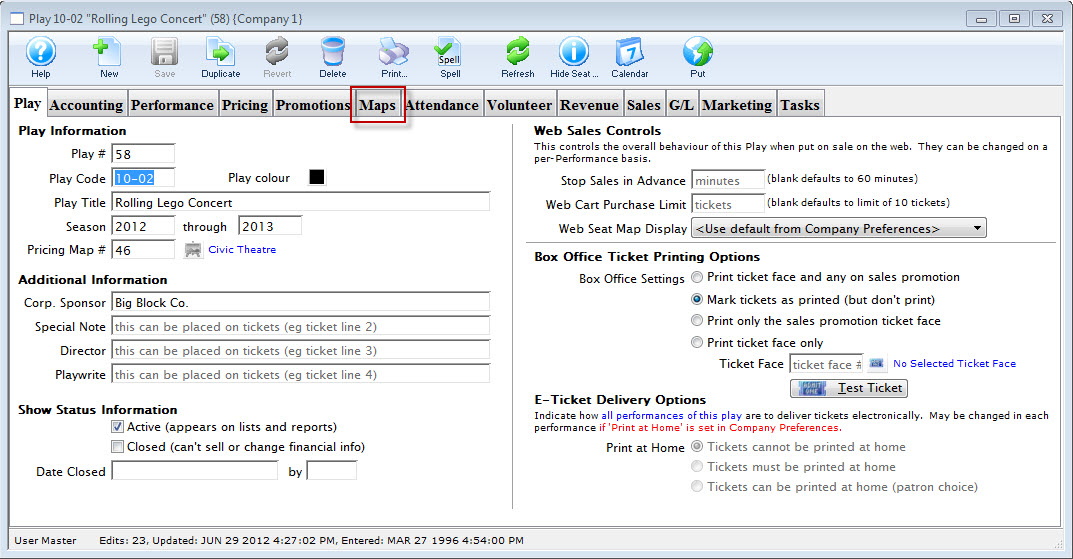
- Select the Map tab.
- Single click on the performance.
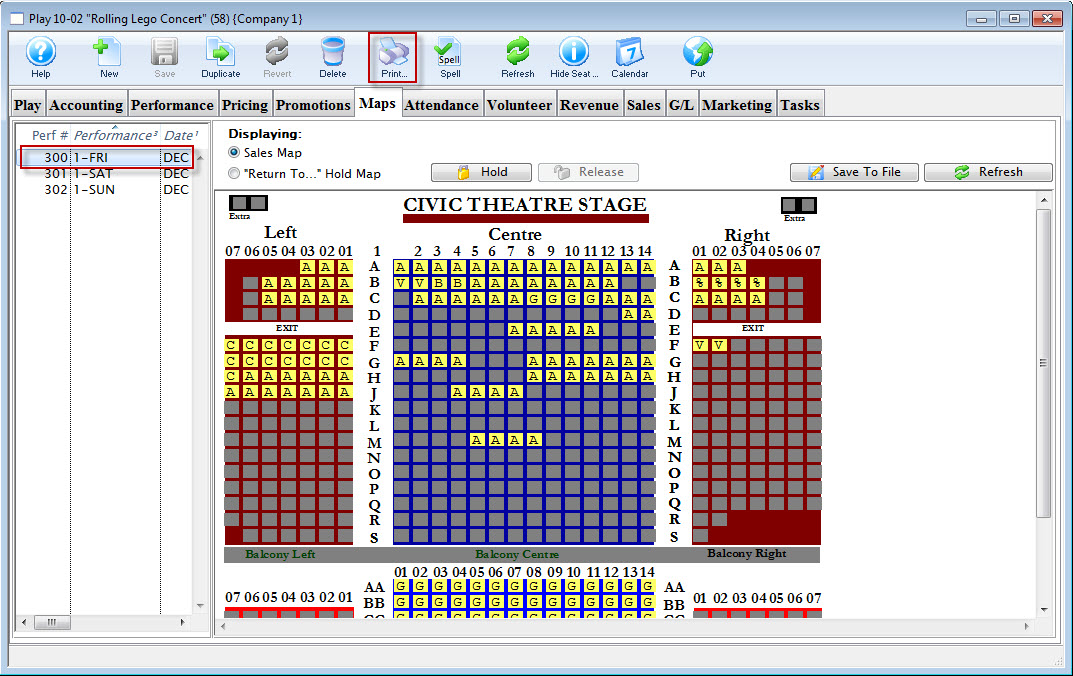
- Click the Print
 button.
The Graphic Map by Performance prints.