Adjusting width of widget in the dashboard
Adjusting Number of Widgets across the page
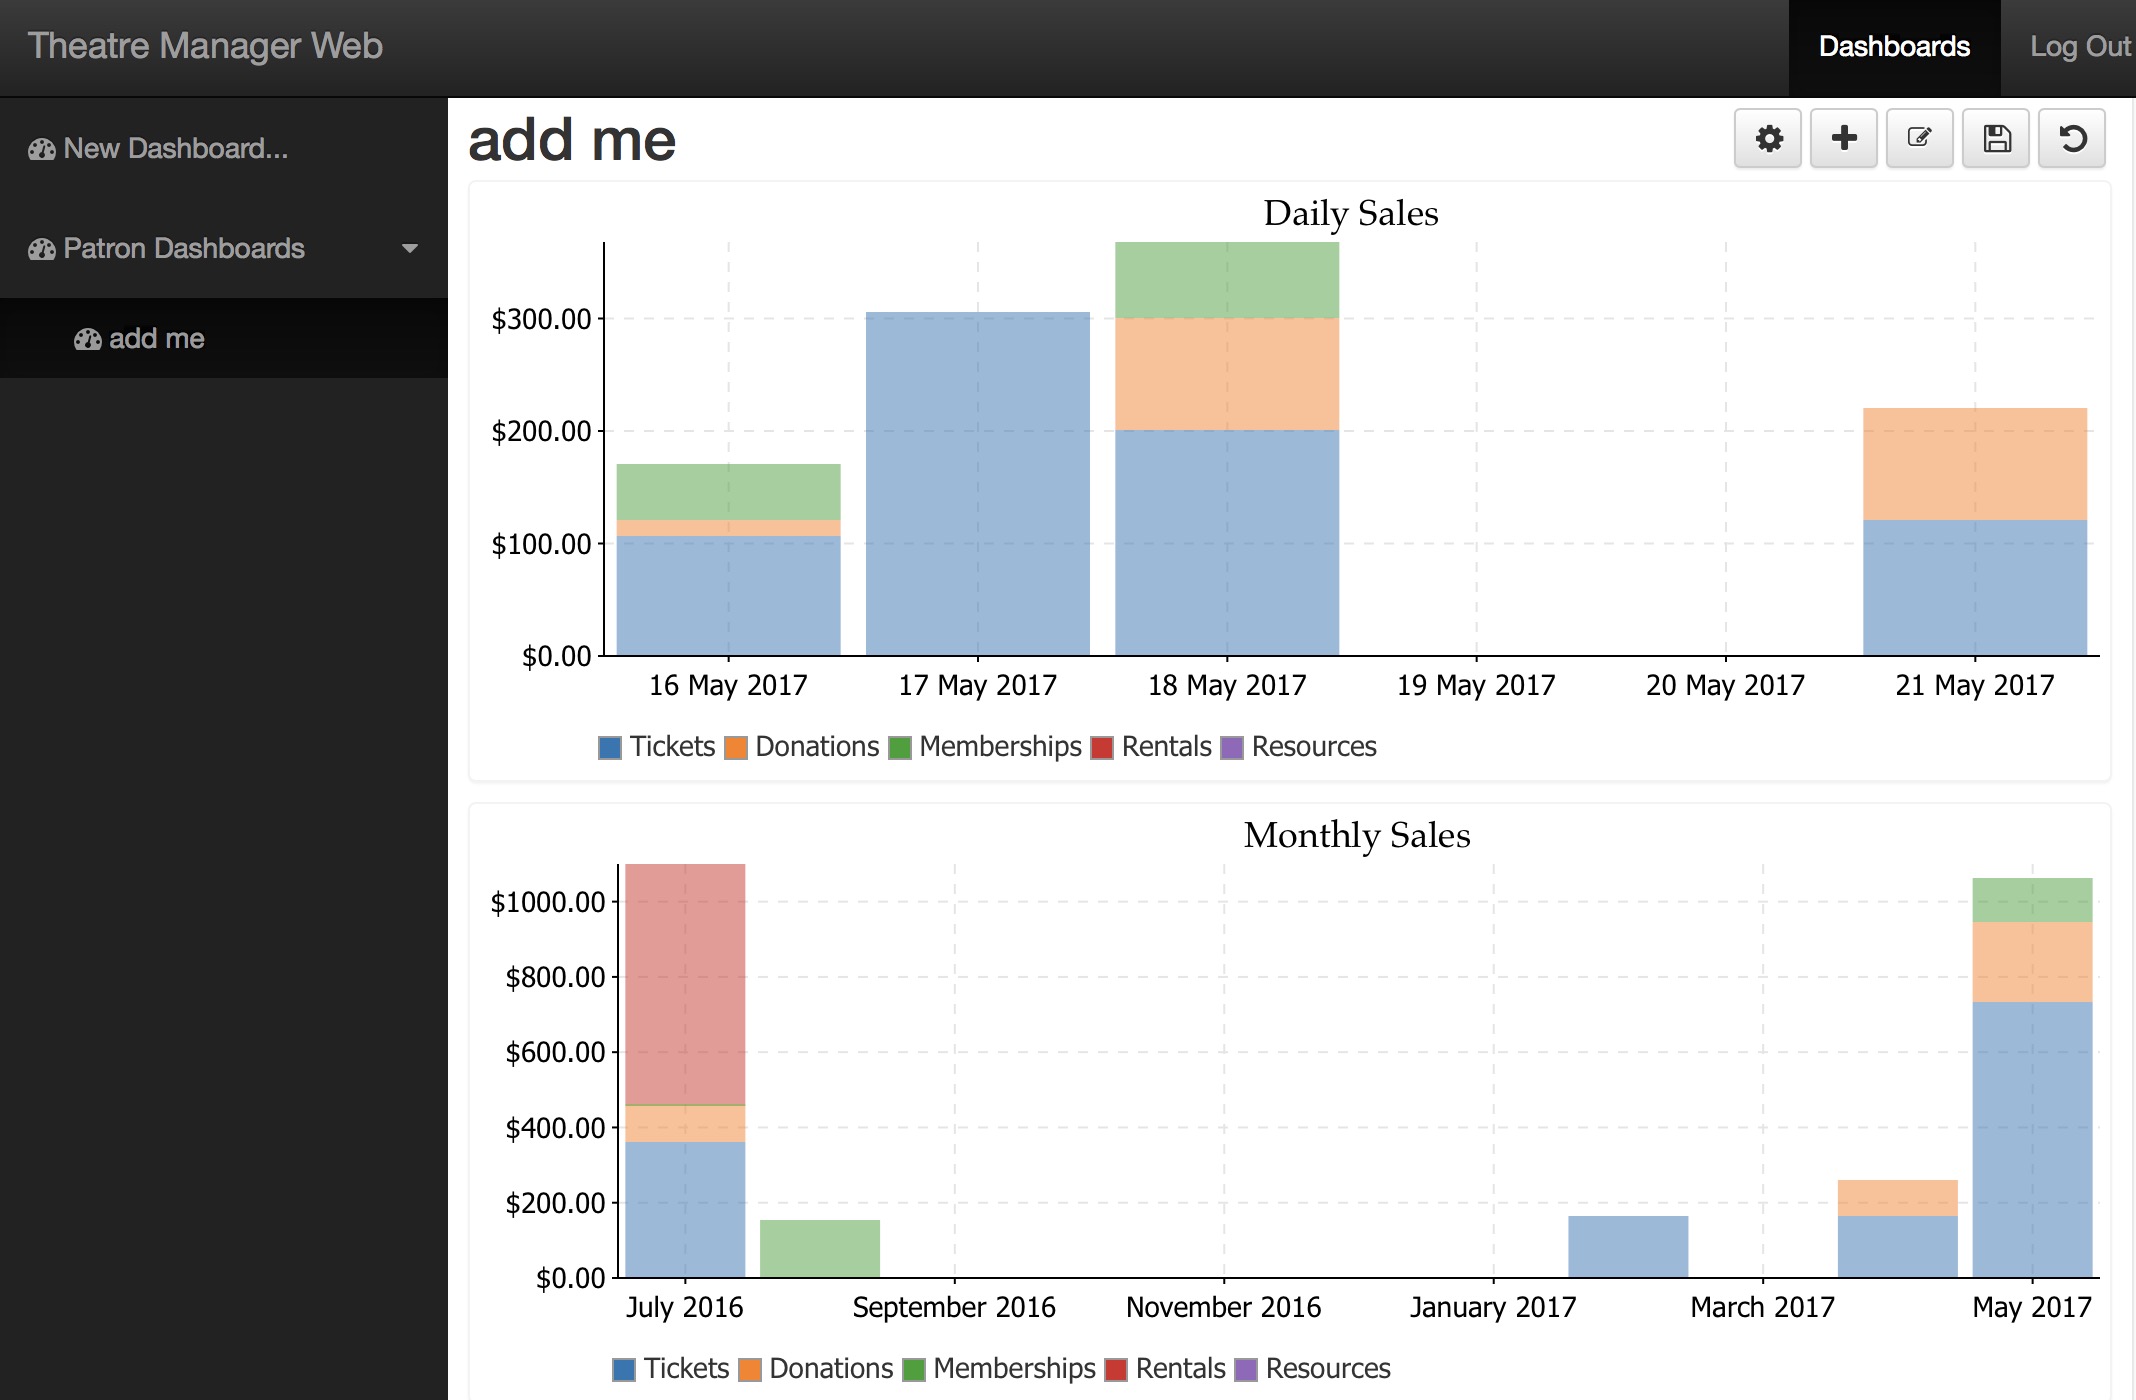
You can adjust the number of dashboard widgets that will go across the page.
- Since Reveal is built using responsive pages and will display on any device, you can set the number and width of items by clicking on the 'dashboard settings icon'.
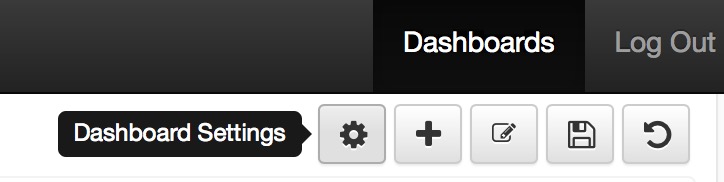
-
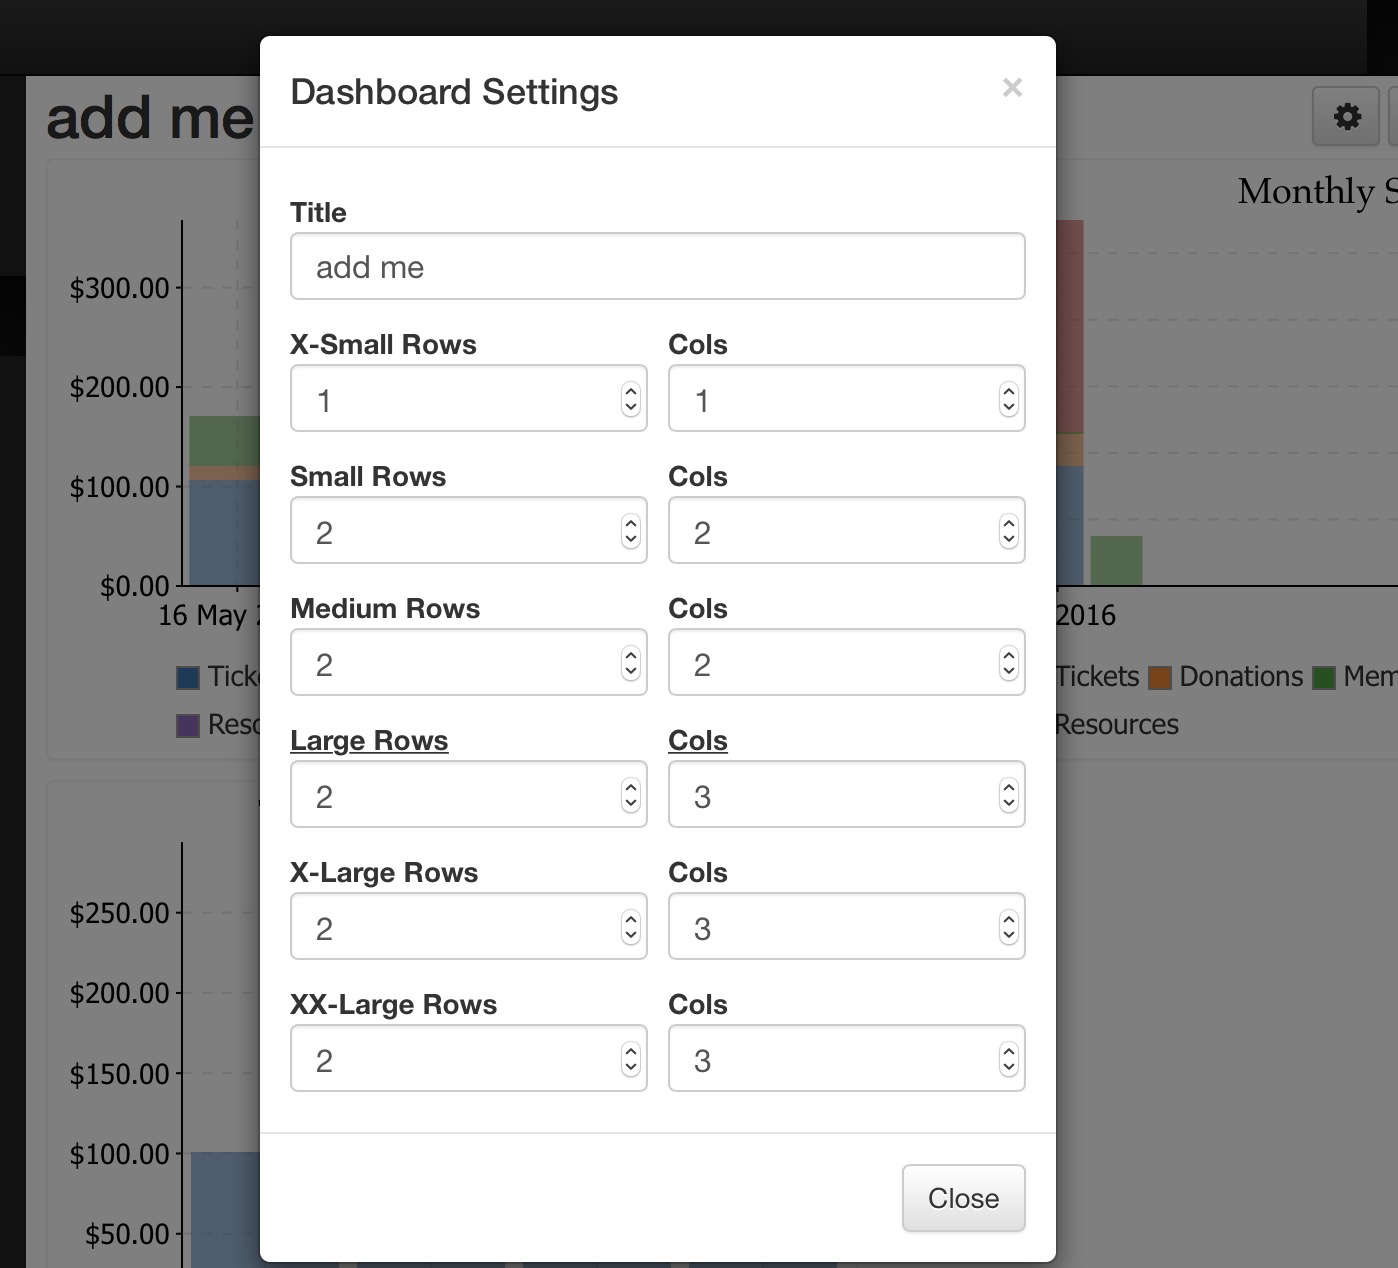
When you do that, you'll get a window that shows the number of rows and columns that charts will take up for various device widths. For example:
- a small device using X-Small rows will show one graph in a column
- a browser oriented with large rows (underlined to indicate the current device) will show the graph at twice height and 3 columns of charts
 |
You can also rename the dashboard at the top of this dialog. |
Wider or Taller Graphs
- If you want wider or taller graphs, just change the row or column value as necessary. Fewer columns on larger dashboards means that the horizontal axis is stretched.
- This example show a the setting for 'large' rows where we only want to have one column of graphs. The graph expands to take up the entire row.