Hot Seat Analyzer
 The hot seat analyzer tool can be used to:
- Determine the usage frequency of seats in a venue and/or the revenue capacity of a particular seat and provide a heat map
- Find out if the current price zones in the venue are appropriate or if they should be allocated differently to accommodate customer preferences in your venue.
Using the tool, you may replace the typical bands of seats with different pricing on aisles or zones in the venue.
How to Start the Hot Seat Analyser
to use the hot seat analyzer, you perform the following steps:
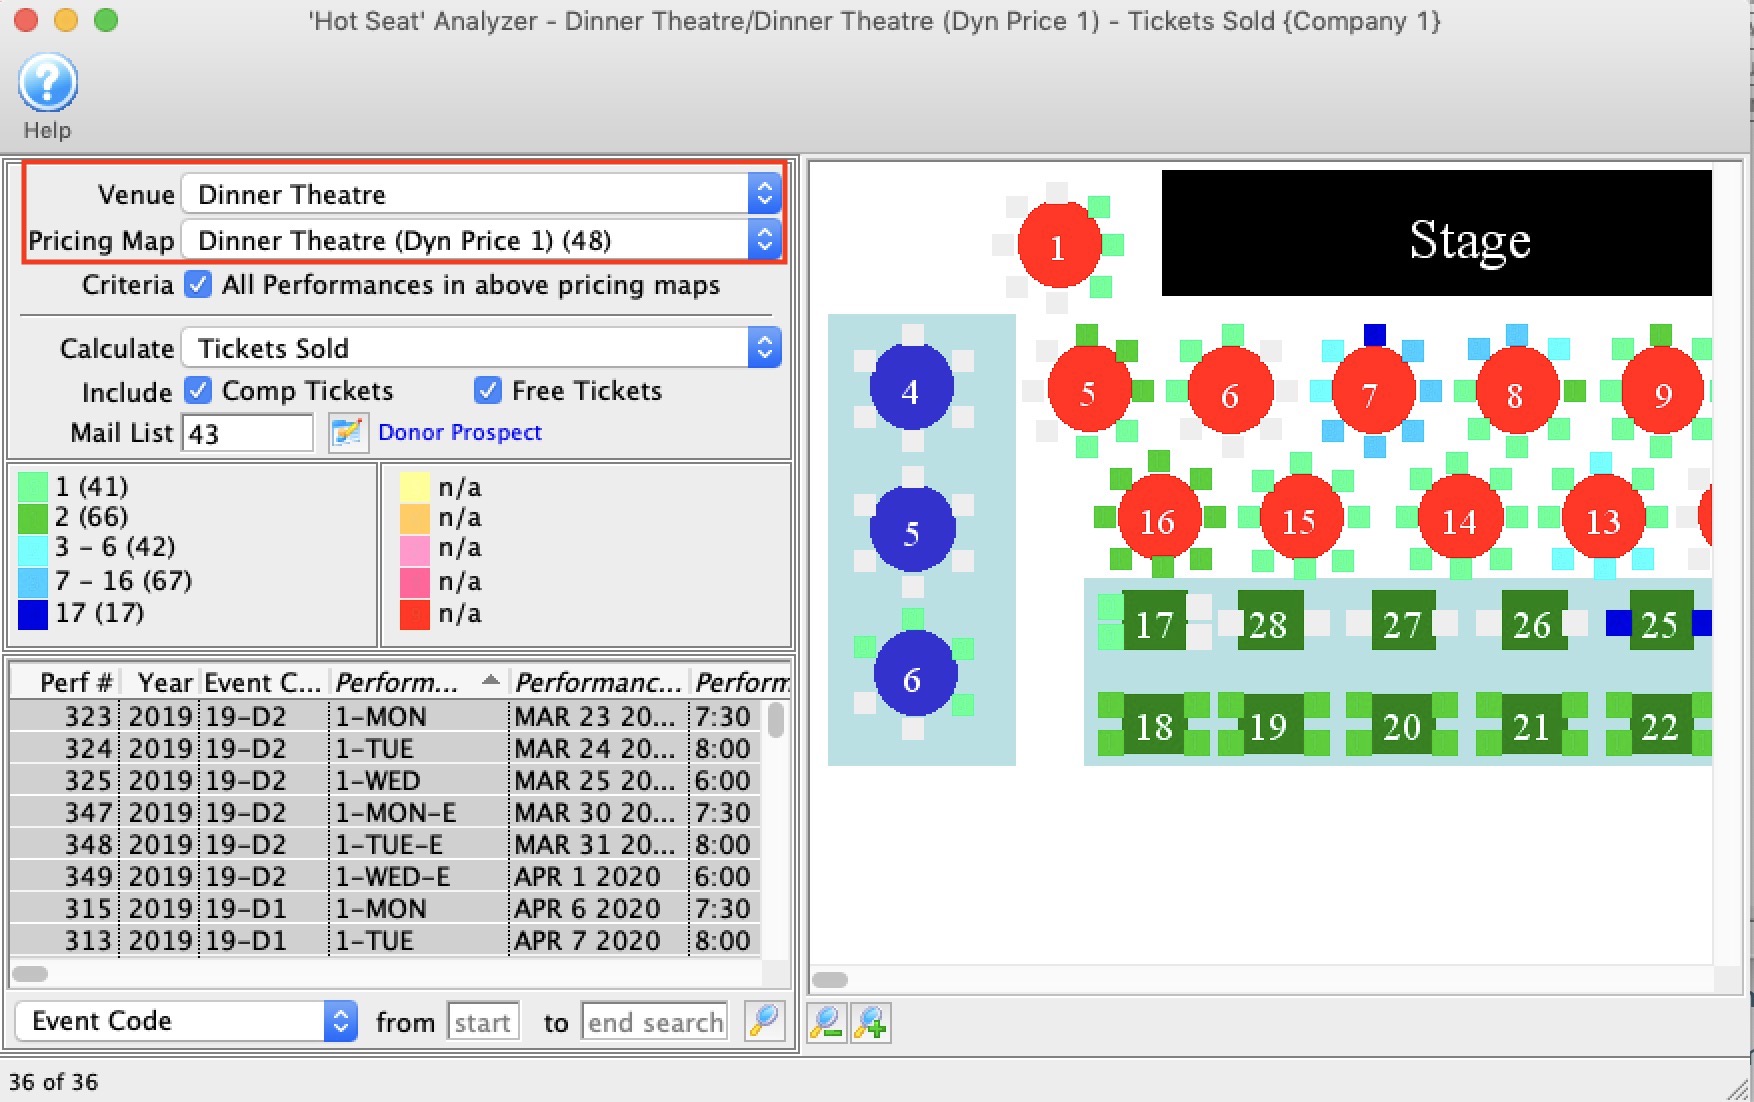
- From the main menus, choose Patron Sales -> Hot Seat Analyzer
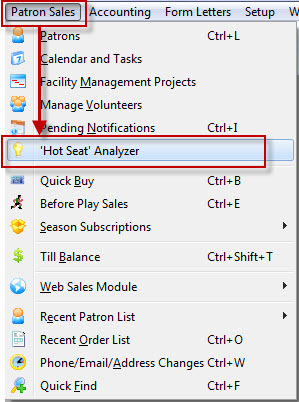
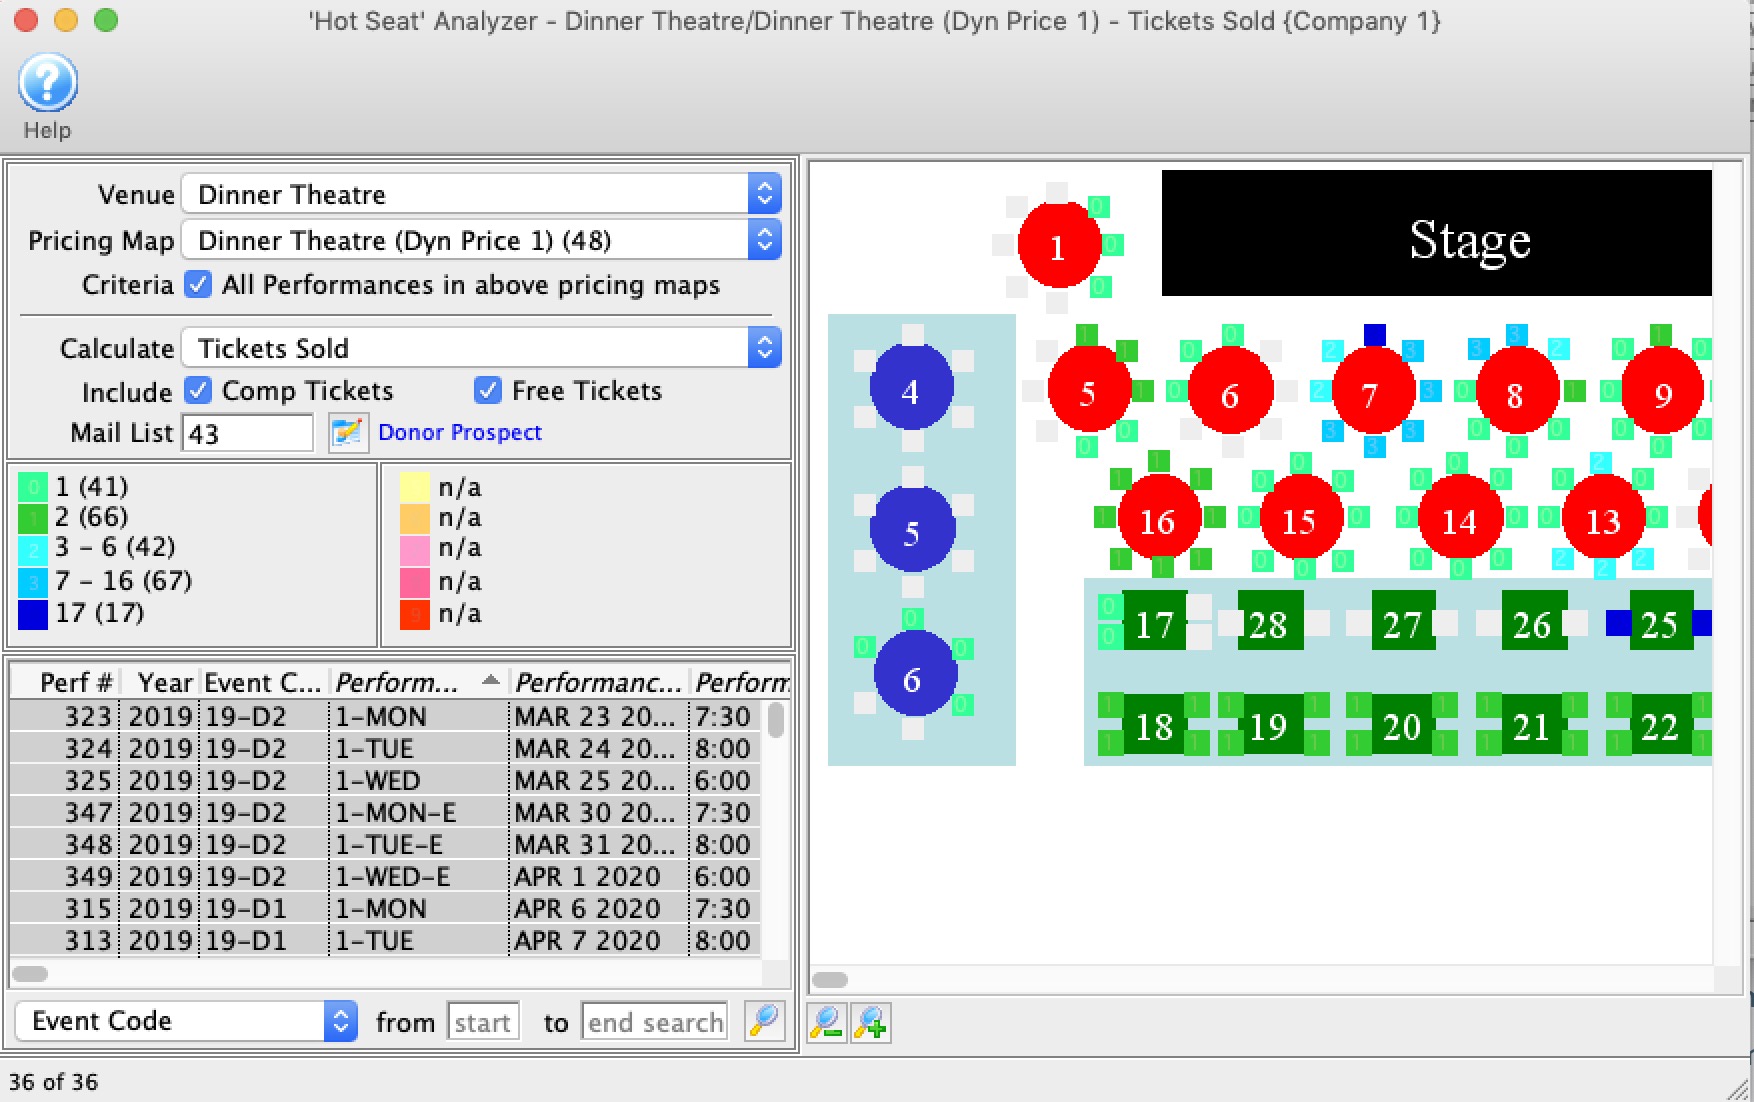
The Hot Seat Analyzer opens.
- Choose a Venue/Theatre from the drop down list.
- Choose a Pricing Map from the drop down list.
Theatre Manager shows the reserved seating events in the venue that are active.
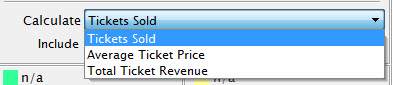
- Choose a summary method from the drop down list.
Select if you want the seat display to:
- Include comps - which are tickets that had a value, but were discounted to zero using a promotion
- Include free tickets - which are tickets that started off at a zero price
- Include patrons that are part of a mail list. You could limit the patrons displayed on the hot seat analyzer to include:
- only a certain list of donors. eg: if you wanted to see where people who gave between $200 and $250 tended to sit
- last years purchasers or prior year purchases. eg: if you made a zone change in the venue for this year, did it change prior patrons buying habits
- people who bought 3 or more tickets. eg: do multiple ticket buyers have a preferences for are in the venue?
- people who are both donors and volunteers. eg: are the volunteers telling you something about best view in the house?
- any kind of grouping you wish. If no mail list is provided, then all patrons with tickets are included.
- Select a range of performances in the list on the left that you want to analyze.
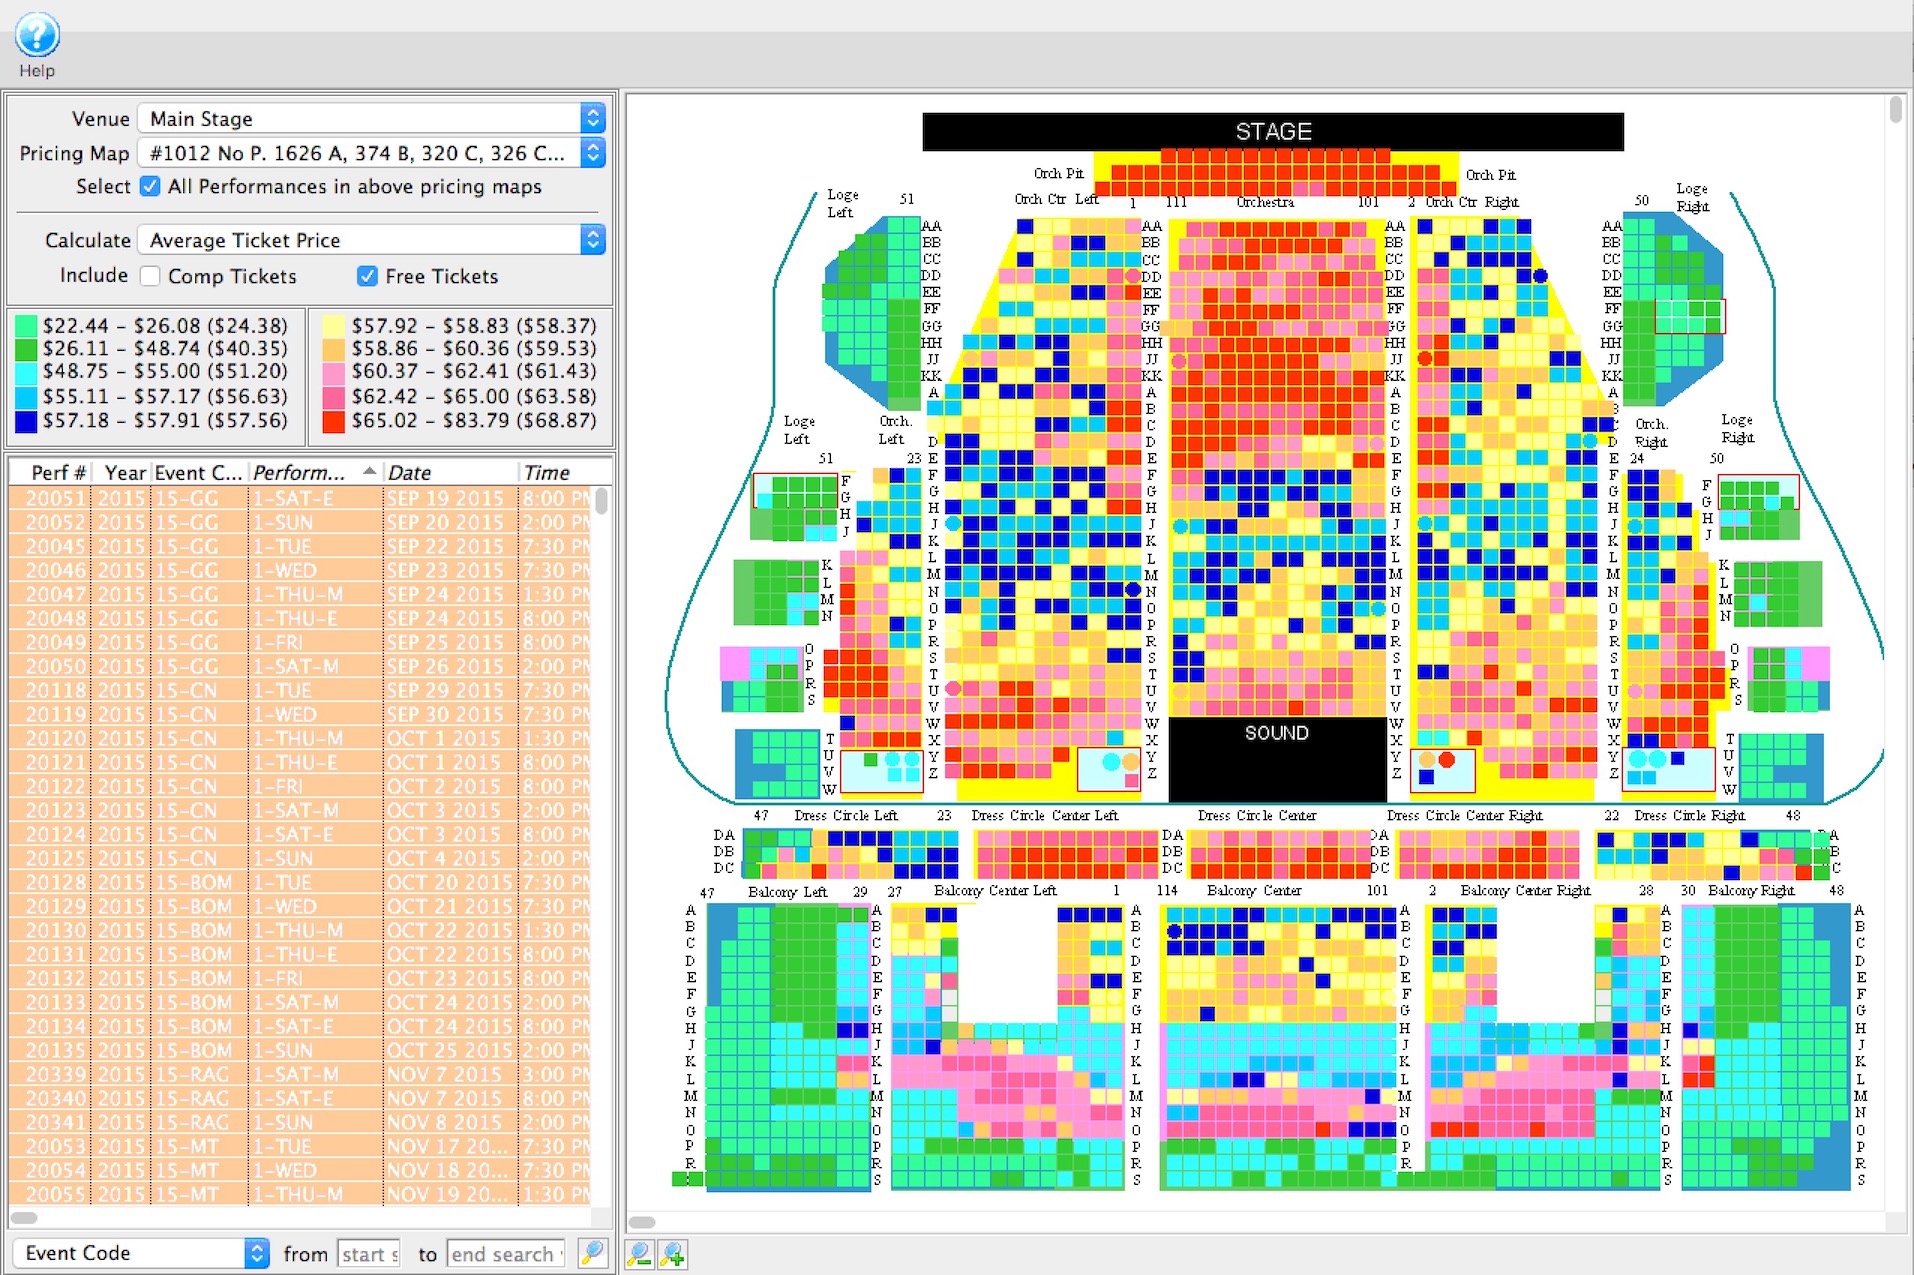
Theatre Manager aggregates information based on the seats that are sold in the map, and adjusts the legend.
|
As the performances and options are changed, Theatre Manager automatically adjusts the legend and colour scaling. That means a colour on one analysis does not necessarily mean the same as the same colour on another seat analysis. |

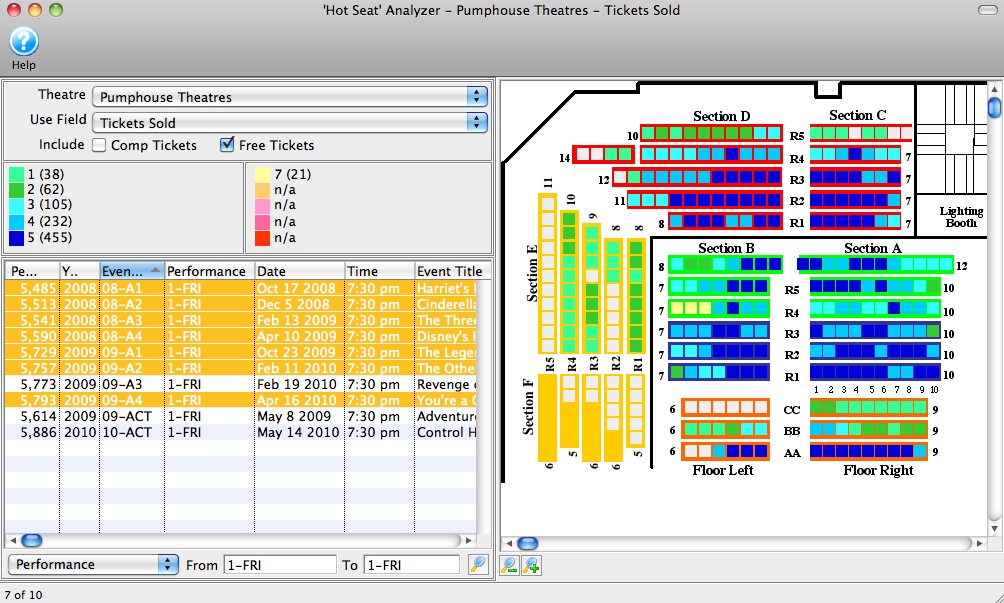
Seating Quantity Example
- the range of tickets sold into each seat across an event called 'High School Musical'.
Most times, the range will show something like 10 - 23 (999) which means tickets in this range were sold to individual seats between 10 and 23 times.
- total number of tickets sold within that range. In the example above, the 999 means the total number of tickets sold i for seats in that range.
What does it show?
- Even on an 10 day run, the balcony had at least 5 seats sold. It gives a measure of desirability of the seat.
- the centre was sold out most nights, seemingly being more popular.
This tells you where people wanted to sit (sometimes its something you already know, but this proves it). In this case, it also proves that people didn't really like the second row in the front, despite that the seats are close to the stage.
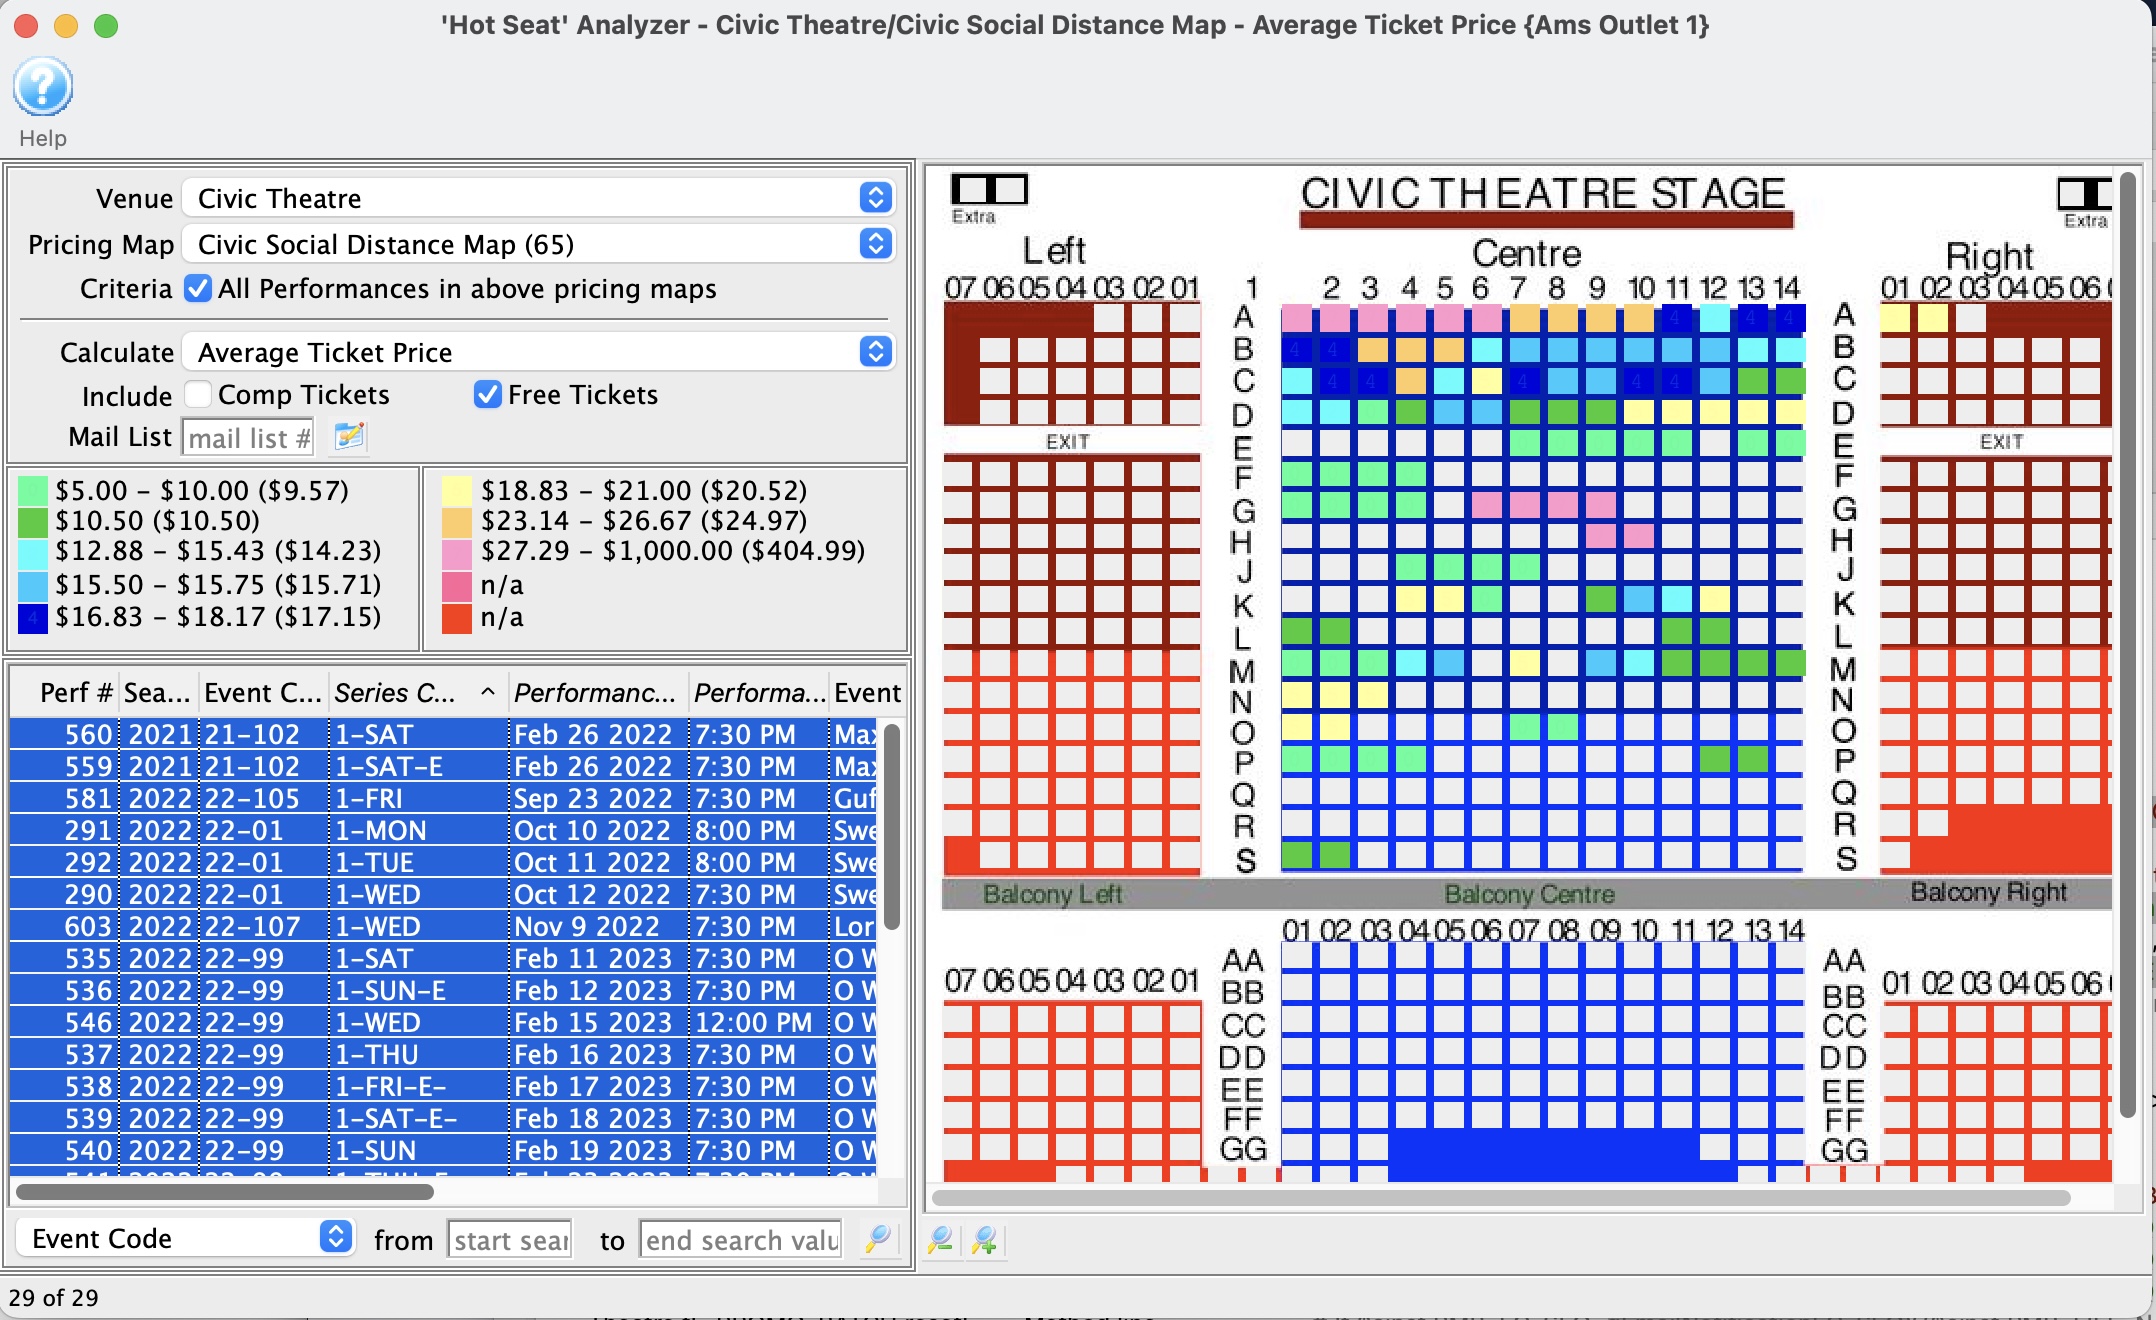
Average Price Example
- The average ticket price in the range. In the first grouping, tickets in the range cost between $5.00 and $10.00.
- The average value of seats sold in this group is in parenthesis. If all tickets are added up and an average calculated, it shows as $9.57 in the example.
This helps show price sensitivity. In a range of prices, if the average is towards the lower end, then the higher end price ls not as desirable (in that range). If its towards the higher end it may indicate less price sensitivity - but you have to examine the reason for prices in that area.
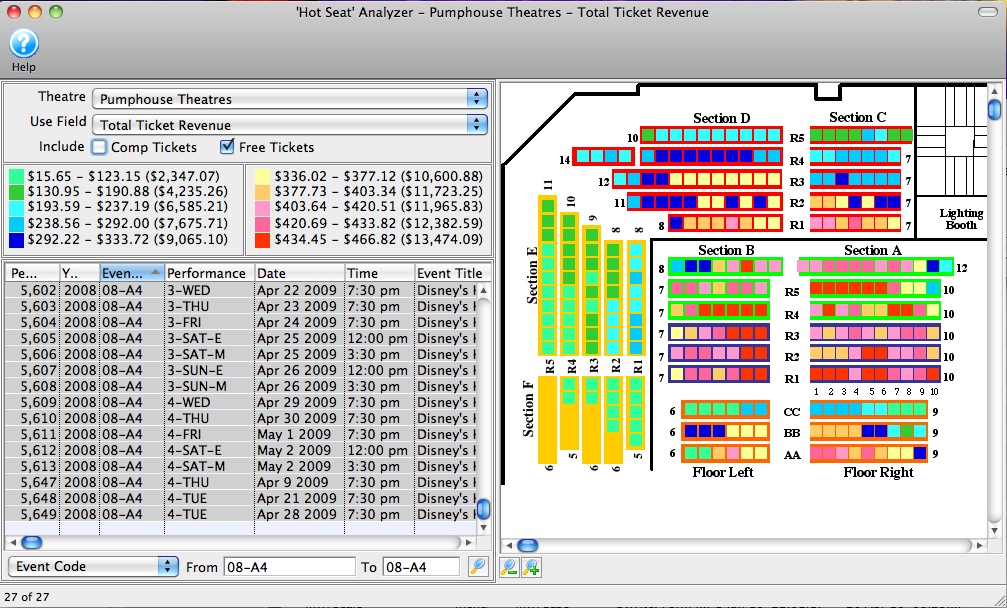
Gross Revenue Example
Yet a row back, the seats were realizing $336-$377. The implication is that being nice and discounting a prime area was a $100 hit for the run of the show per seat. For 10 seats, that is $1000.
Opening Night Example
You can see that people like the front, but nobody wants the sides. This might have been something you know, but it might also be something that you want to quantify and move unpaid tickets to less desirable areas so that donors can have the better seats.